AI Assist History
The AI Assist History page provides a centralized view of automated AI Triage and AI Remediation operations in Checkmarx One. It enables you to monitor operations in progress and review the outcomes of completed operations, including the number of risks triaged or remediated, skipped, or failed.
You can filter the history by operation type, scanner, project, and date range, and export the results to a CSV file.
For information about configuring automated operations and defining which risks are eligible for processing, see AI Triage & Remediation.
Note
Only automated operations are displayed. Manually initiated AI Triage and AI Remediation operations are not included.
Viewing AI Assist History
To access the page, navigate to Resource Management > AI Assist History.
The page displays operations from the Last 30 Days by default, sorted by completion date with the most recent first.
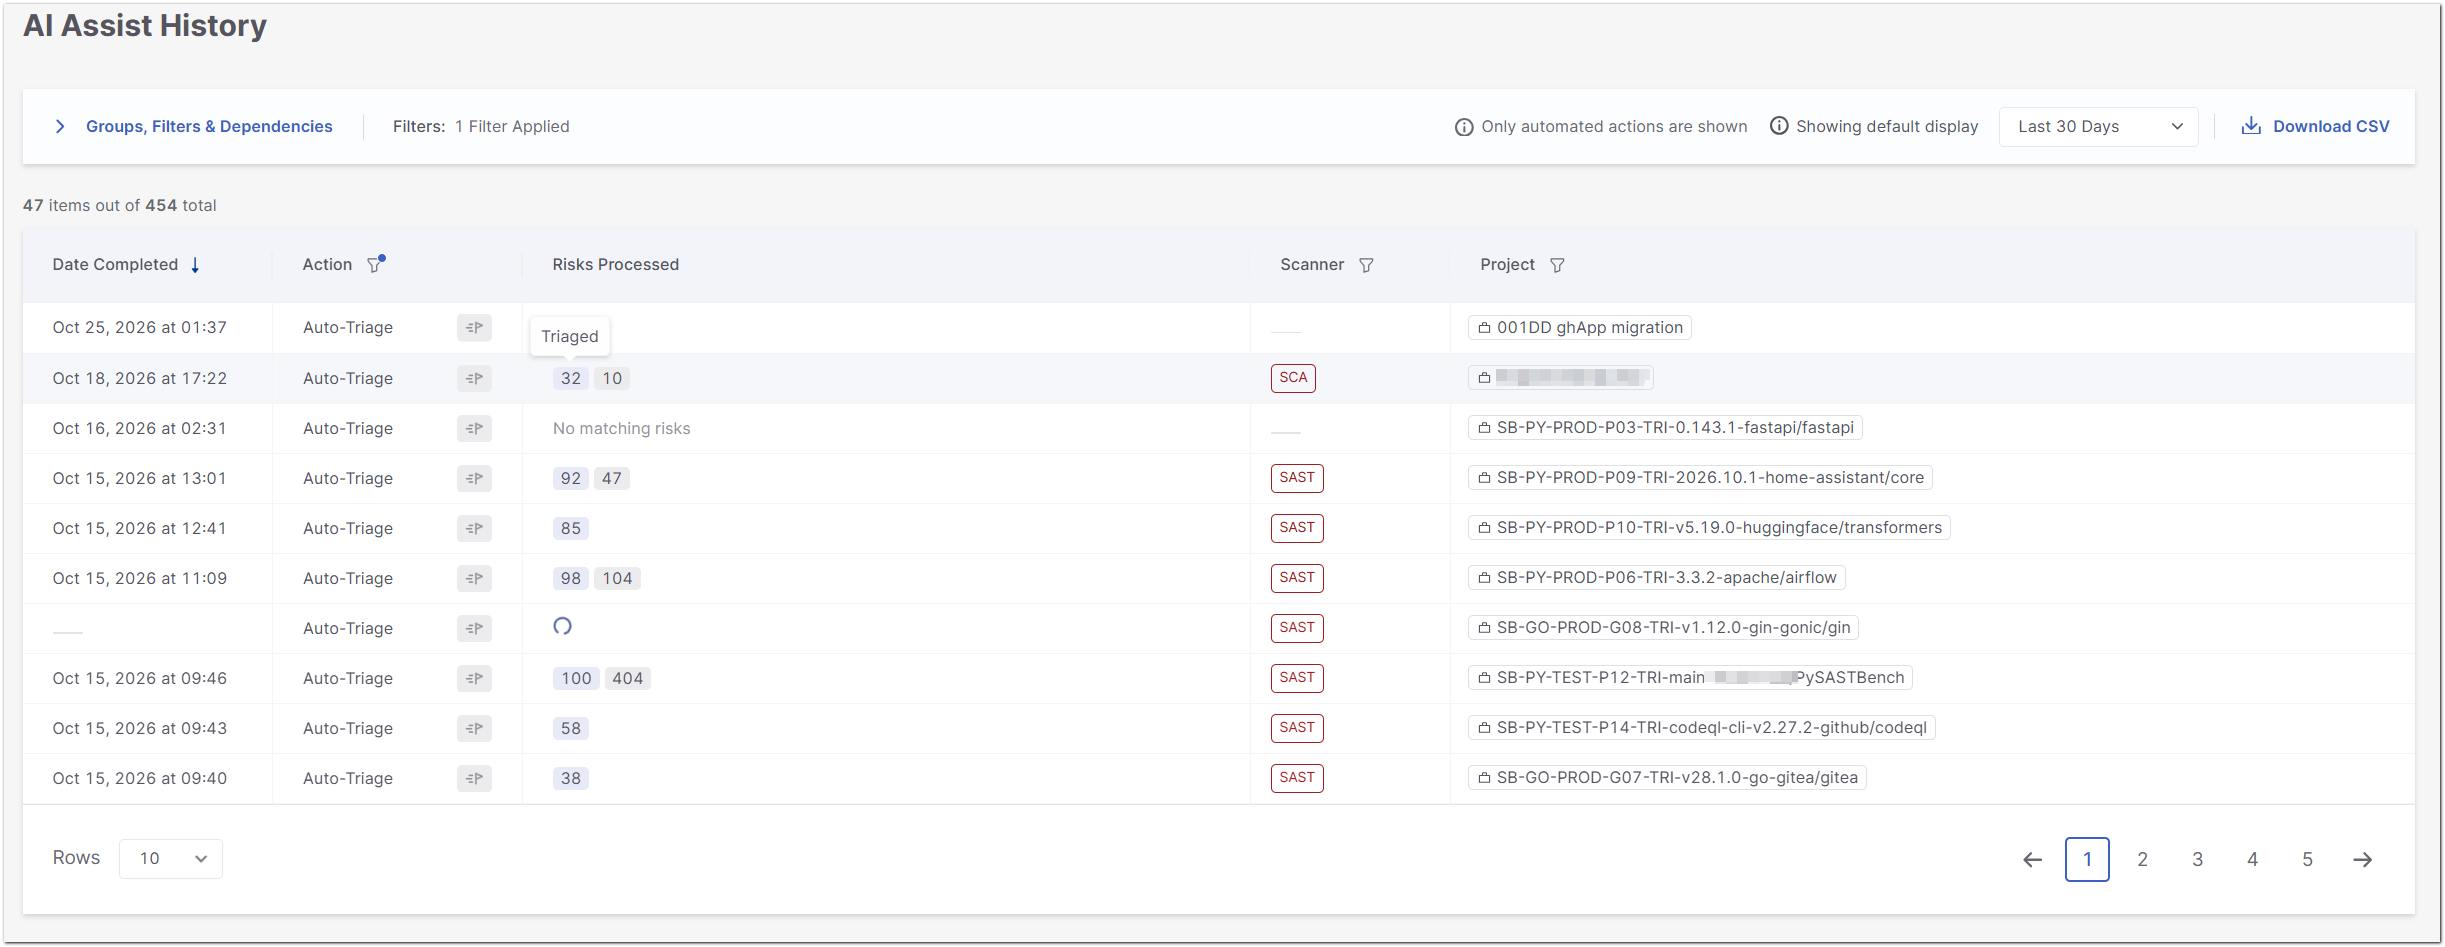
Understanding the AI Assist History Table
Each row represents an automated AI Triage or AI Remediation operation.
Column | Description |
|---|---|
Date Completed | The date and time the operation was completed. This field is empty while the operation is in progress. |
Action | The type of automated operation performed: Auto-Triage or Auto-Remediation, accompanied by an icon identifying the operation type. |
Risks Processed | The number of risks processed during the operation, categorized by outcome. Hover over a number to see its status: Triaged or Remediated (blue), Skipped (gray) indicates risks that were not processed during the operation, or Failed (red). A loading indicator appears while an operation is in progress. If no risks match the processing criteria, No matching risks is displayed. |
Scanner | The scanners associated with the operation, such as SAST or SCA. An operation can include multiple scanners. |
Project | The project associated with the operation. |
To view individual risks and their AI Triage or AI Remediation results, see Risk Orchestration.
Filtering and Sorting History
Use the following options to customize the displayed history:
Date Range: Select the period for which you want to view operations. The default is Last 30 Days.
Column Filters: Click the filter icon next to Action, Scanner, or Project to filter the displayed operations.
Groups, Filters & Dependencies: Expand this section to manage the table's filtering options.
Sorting: Click the Date Completed column header to sort operations by completion date in ascending or descending order.
Set to Default: Save the current table view, including filters and sorting preferences, as your default view.
Revert to Default: Restore the table to your saved default view.
Pagination: Use the Rows dropdown to select the number of entries displayed per page, and the pagination controls to navigate between pages.
Exporting History
Click Download CSV to export the history data.
The CSV file includes all records matching the selected filters and date range, including records that are not displayed on the current page.