Application Details Page
To access the Application Details Page, hover over the desired application in the Applications Page and click on  .
.
The Application Details Page is opened, displaying the Overview tab.
Applications Overview
Applications group multiple projects to a logical entity.
The Applications Overview presents aggregated information and analytics for a group of projects within the framework of an application.
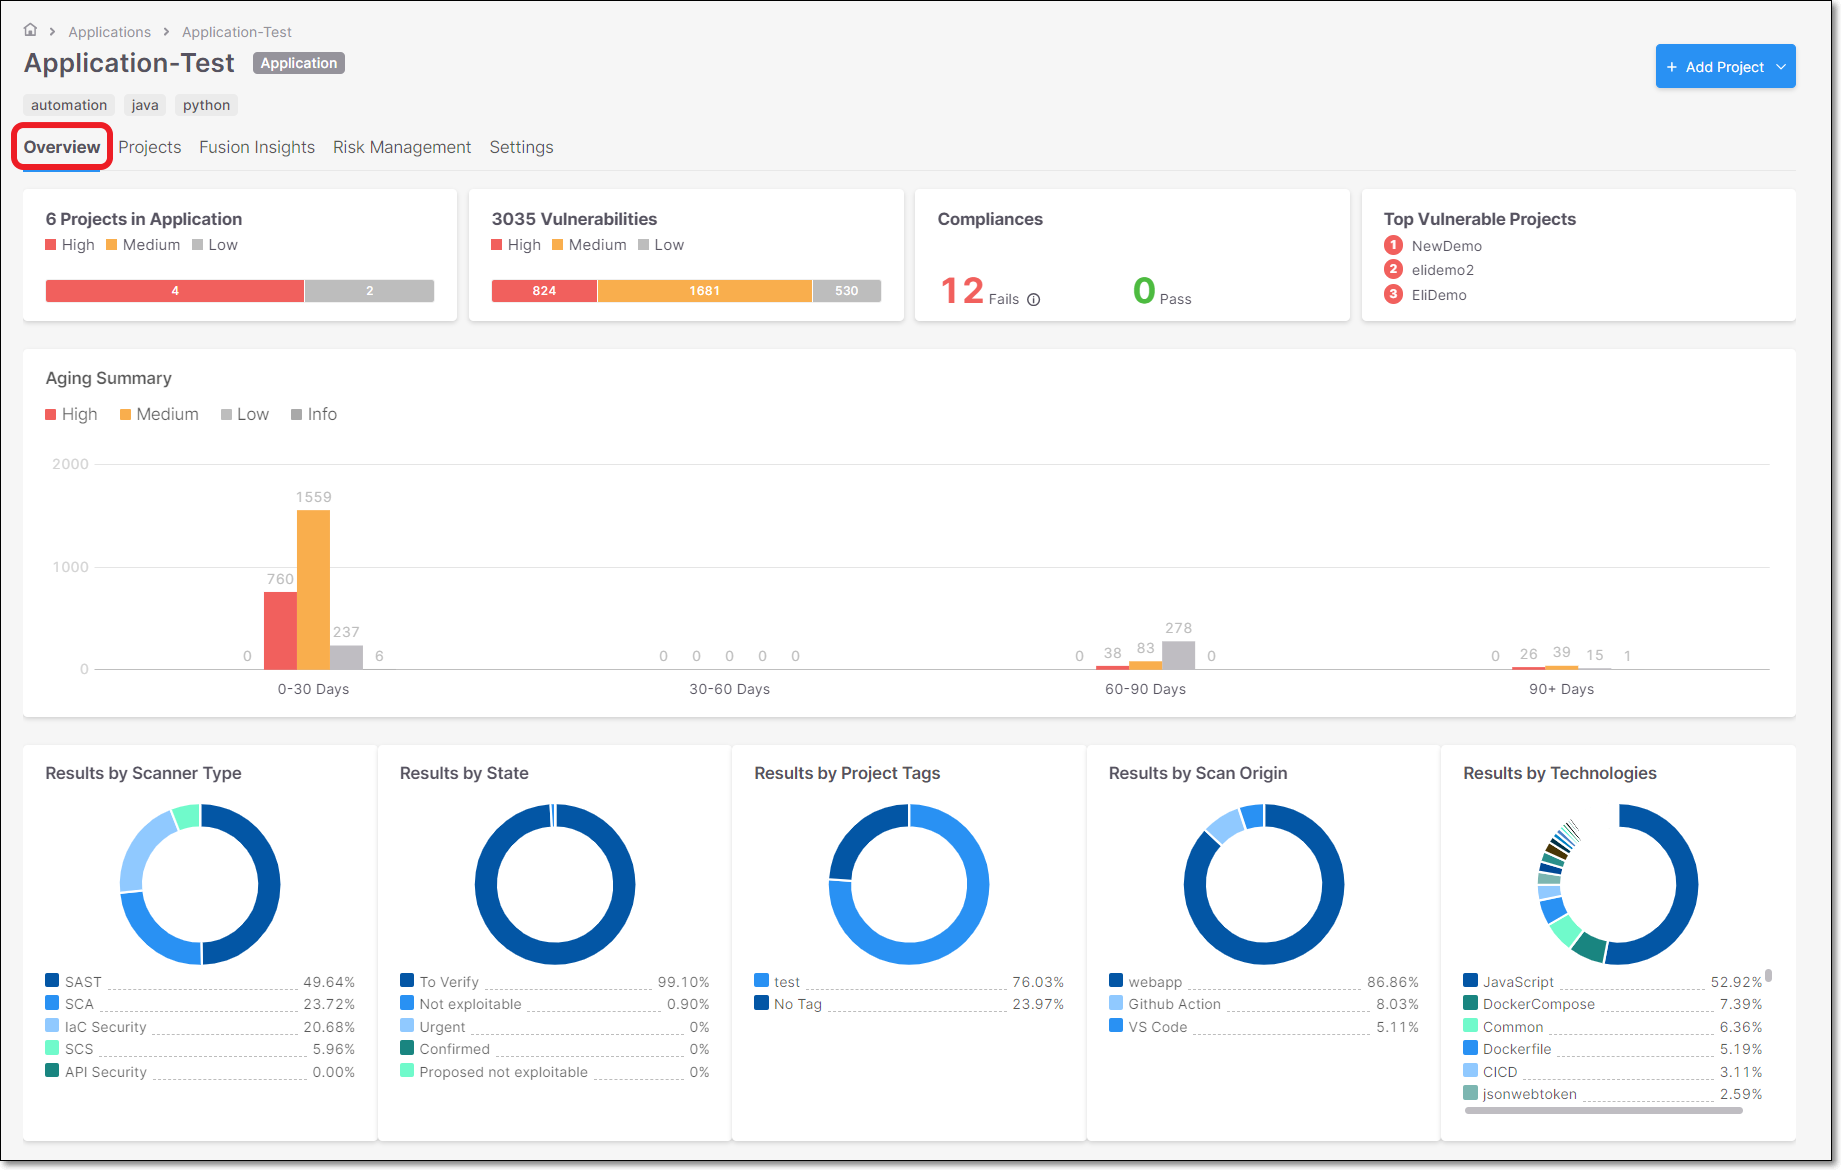 |
Overview Widgets
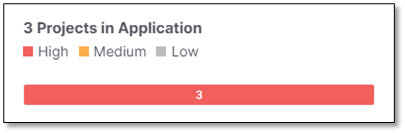
Projects in Application
The Projects in Application widget displays the risk level of each project assigned to the application with a scale of Critical, High, Medium and Low.
The data reflects the last scan in the application for the selected branch.
 |
Vulnerabilities
The Vulnerabilities widget display the total number of vulnerabilities from all the Projects' severities (Critical, High, Medium, Low).
This visualization does not include vulnerabilities marked as Not Exploitable.
 |
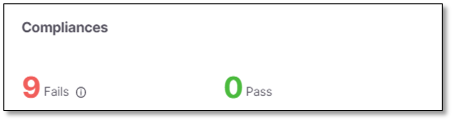
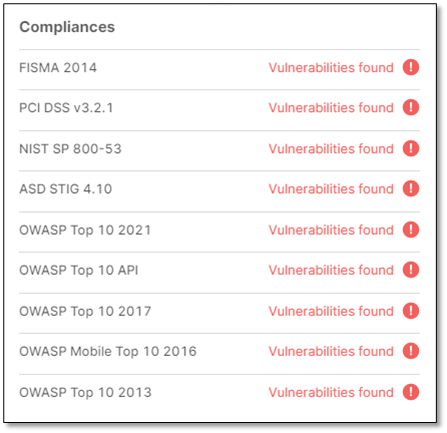
Compliances
Summarizes the projects compliances.
 |
Point to  for the list of vulnerability categories in which the vulnerabilities detected in SAST are categorized.
These categories are explained in the table below.
 |
Categories | Description |
|---|---|
FISMA 2014 | Displays the vulnerabilities associated with categories (2014), as defined by FISMA (Federal Information Security Modernization Act). All vulnerabilities that do not fall into any of the FISMA categories are listed as Uncategorized. |
PCI DSS v3.2.1 | Displays the vulnerabilities associated with categories (DSS v3.2), as defined by PCI (Payment Card Industry). All vulnerabilities that do not fall into any of the PCI categories are listed as Uncategorized. |
NIST SP 800-53 | Displays the vulnerabilities associated with categories (SP 800-53), as defined by NIST (National Institute of Standards and Technology). All vulnerabilities that do not fall into any of the NIST categories are listed as Uncategorized. |
ASD STIG 4.10 | Displays vulnerabilities categorized by the DISA Application and Development STIG once the STIG post-installation script has been run. |
OWASP Top 10 2021 | Displays the vulnerabilities associated with categories (A1 to A10) that appear in the list of the 10 most serious risks, as defined by OWASP (Open Web Application Security Project). All vulnerabilities that do not fall into any of the OWASP Top 10 2021 categories are listed as Uncategorized. |
OWASP Top 10 API | This category specifically addresses API Security and categorizes vulnerabilities that are related to Broken Object Level Authorization, Broken User Authentication, Excessive Data Exposure, Lack of Resources & Rate Limiting, Broken Function Level Authorization, Mass Assignment, Security Misconfiguration, Injection, Improper Assets Management and Insufficient Logging & Monitoring. |
OWASP Top 2017 | Displays the vulnerabilities associated with categories (A1 to A10) that appear in the list of the 10 most serious risks, as defined by OWASP (Open Web Application Security Project). All vulnerabilities that do not fall into any of the OWASP Top 10 2017 categories are listed as Uncategorized. |
OWASP Mobile Top 10 2016 | Displays the vulnerabilities associated with categories (M1 to M10) that appear in the list of the 10 most serious risks, as defined by OWASP (Open Web Application Security Project). All vulnerabilities that do not fall into any of the OWASP Mobile Top 10 2017 categories are listed as Uncategorized. |
OWASP Top 10 2013 | Displays the vulnerabilities associated with categories (A1 to A10) that appear in the list of the 10 most serious risks, as defined by OWASP (Open Web Application Security Project). All vulnerabilities that do not fall into any of the OWASP Top 10 2013 categories are listed as Uncategorized. |
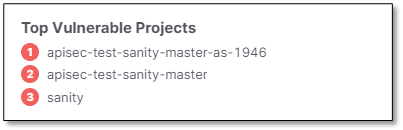
Top Vulnerable Projects
Presented in word cloud style, where the three top vulnerable Projects are displayed with different risk level colors.
 |
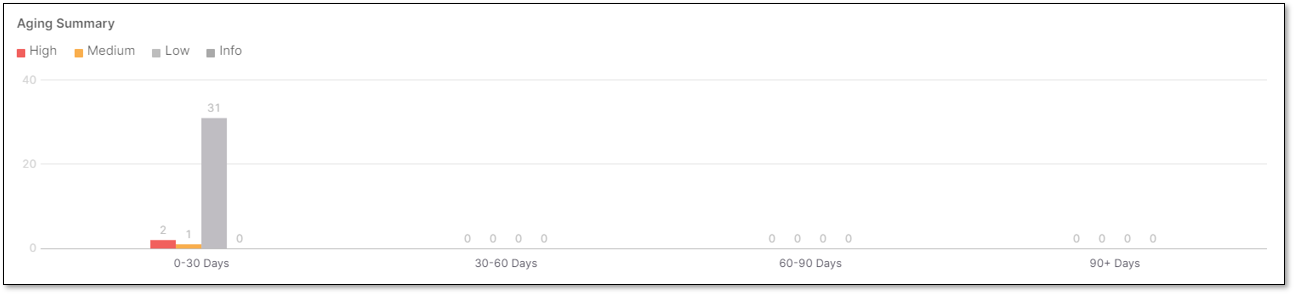
Aging Summary
The Aging Report widget presents the amount of vulnerabilities distributed by severities (Critical, High, Medium, Low) for the first discovery date in a specific time range. The data reflects the last scan in the project for the selected branch.
The widget includes a bar chart presentation with the following parameters.
x-axis - Presents 4 constant time ranges:
0 - 30 days
30 - 60 days
60 - 90 days
90+days
y-axis - Presents the amount of vulnerabilities.
Chart data - 3 stacked bars per each time range (Critical, High, Medium, Low) with the amount of vulnerabilities per bar type.
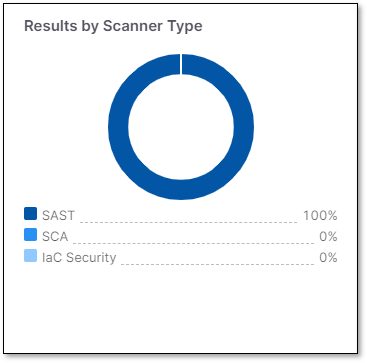
Results by Scanner Type
The results are displayed as pie charts for all the projects assigned to the application.
They indicate the aggregated number of vulnerabilities found per scan type:
SAST
SCA
IaC Security
API Security
Vulnerabilities flagged with the state of Not Exploitable are not included.
 |
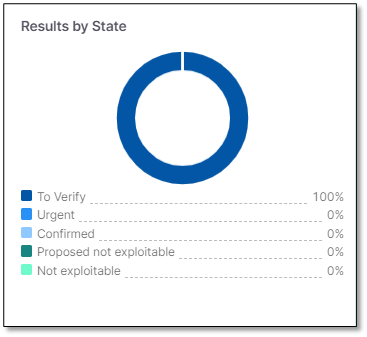
Results by State
Displays the aggregated number of vulnerabilities per state from all the projects assign to the application.
To Verify
Not Exploitable
Proposed Not Exploitable
Confirmed
Urgent
Vulnerabilities flagged with the Not Exploitable state are counted, only for this visualization.
 |
Results by Projects Tags
Displays the aggregated number of vulnerabilities found per project tag from all the projects assigned to the application.
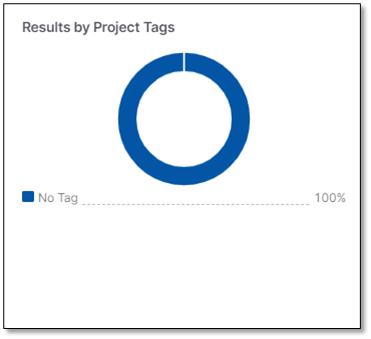 |
Note
Vulnerabilities labeled Not Exploitable are not counted.
Results by Scan Origin
Displays the aggregated number of vulnerabilities found per scan origin, from all the Projects assigned to the Application.
For example:
Jenkins
Github action
Github webhooks
Checkmarx One webscan
CLI
Webapp
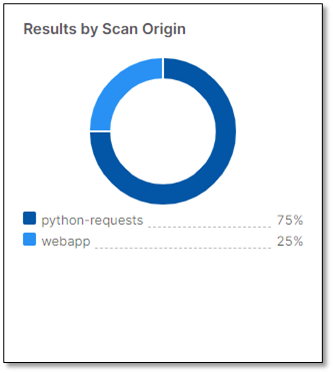
Note
Vulnerabilities labeled Not Exploitable are not counted.
Results by Technologies
Displays the aggregated number of vulnerabilities found per technology from all the Projects assigned to the Application.
The technologies include:
Languages
Platforms
Packages
Multiple versions of the item are aggregated under the same item, but are flagged with the number of versions.
The tooltip lists the versions and any vulnerabilities flagged with the Not Exploitable state are not counted.
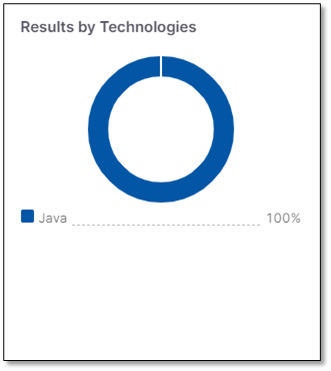 |
Note
Vulnerabilities labeled Not Exploitable are not counted.
Risk Management Tab for an Application
The Risk Management tab on the Application page shows up to 50 of the most severe risks in the application.
This screen can be accessed in one of two ways:
From tha main Application Risk Management home screen, click on Explore Application or hover over an application in the right hand panel and click on View Results.
Navigate to the Workspace
 > Applications page, hover over an application row and click Overview . This will open that specific application's page displaying the overview tab. Click on the Risk Management tab on the top of the screen.
By default, the risks are sorted by Risk Score and shown in descending order, enabling you to quickly identify the most critical risks. You can change the sorting method and apply filters for each column. There is also a quick-filter to show only results for runtime vulnerabilities.
There is a button in the filter bar for accessing the relevant documentation in our documentation portal.
Application Header
At the top of the page, the Application Header is displayed.
 |
Application Name
Application Type Indicator - shows whether the application is a business application or an internal application.
Business - appications that are externally facing or directly support key business functions. Security issues in these apps can lead to customer impact, revenue loss, or reputational damage, making their security a top priority in ASPM.
Internal - applications used solely within the organization, with no direct customer exposure or business-critical operations. Security issues may pose operational risks but do not have immediate business impact.
Impact Rating - the Impact rating (1–5), which reflects the Criticality Level defined in the application settings, and is incorporated into the overall risk score calculation.
Application Risk Score - the overall risk score of the application. The score is made of the impact rating plus the average of the top 50 highest-risk results.
Application Table
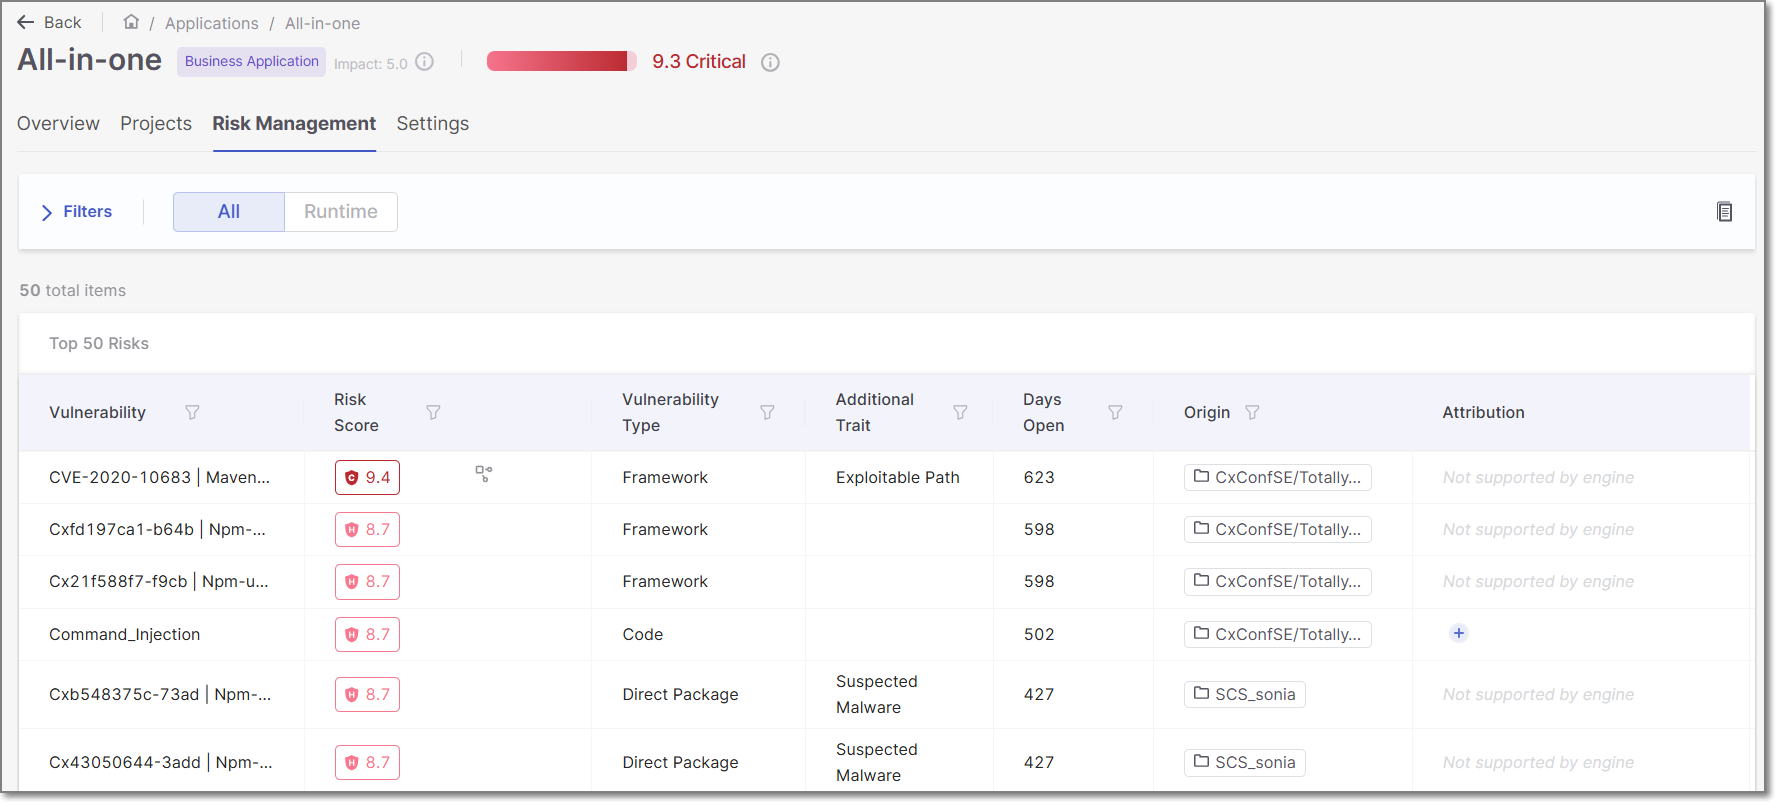 |
Vulnerability Name: The name of the vulnerability. For SAST and IaC Security, this is the type of vulnerability. For SCA, this is a combination of the risk ID and the package in which it was identified. For BYOR, this is rule attribute from the SARIF file (if not provided, then the ruleID is used).
Risk Score: The severity of the risk on a scale from 0.1 (low) to 10 (critical). For more info about how the risk score is calculated see here.
In addition, for accounts with Cloud Insights integration, the
 icon indicates a risk that is Internet Facing.
Vulnerability Type: This column categorizes vulnerabilities based on their general types. Results identified by the SAST scanner are categorized as "Code". SCA results are either "Direct Package" or "Transitive Package". IaC Security results are referred to as "Configuration", and BYOR are referred to as "Imported Results".
Additional Trait - Shows if there are specific additional risk factors. Possible values are currently: "Exploitable Path" and "Suspected Malware".
Days Open: The number of days since the vulnerability was initially detected.
Origin: This column shows the name of the project where the vulnerability was identified.
Attribution: This column shows the users and groups responsible for remediating each vulnerability. For more information, see Risk Attribution.
Risk Score Parameters
Click on the Risk Score for a row in the table in order to open a side panel that shows a breakdown of the risk factors that contribute to the Risk Score calculation.
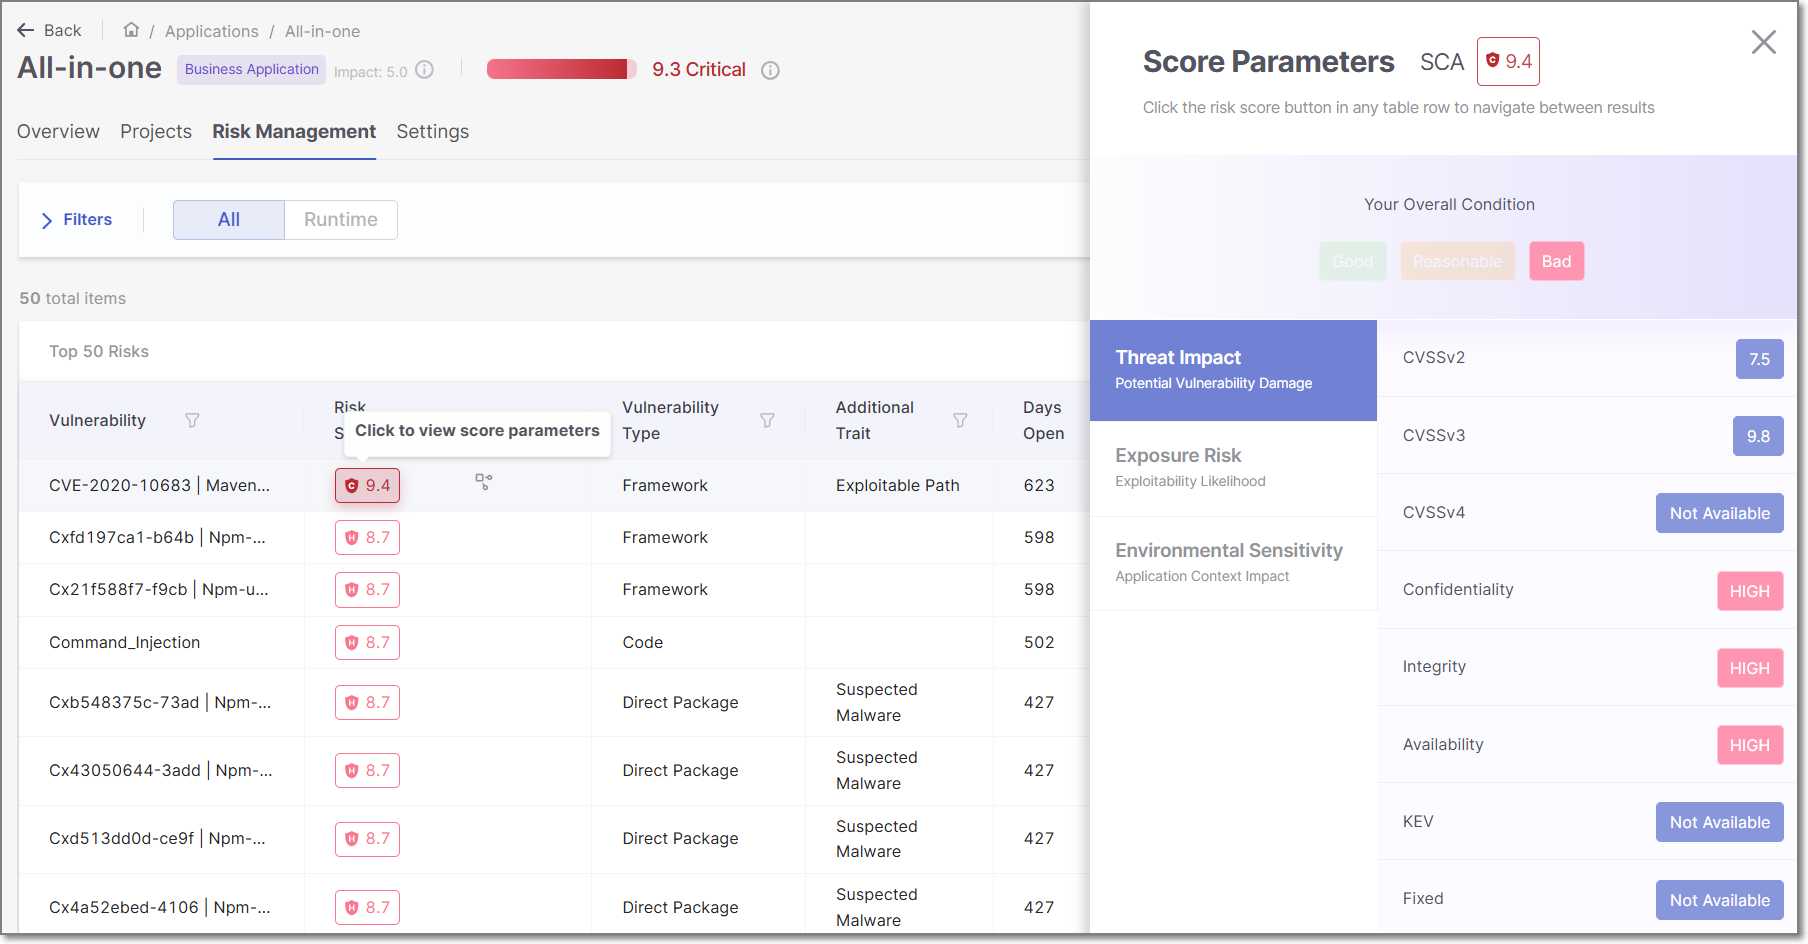
The data shown in this panel differs depending on the scanner that identified the risk. The data is divided into three tabs: Threat Impact, Exposure Risk and Environmental Sensitivity. Click on a tab to show the data for that section. The following is a summary of the data shown in each section:
Threat Impact - Focuses on how much damage a vulnerability could cause if exploited.
Exposure Risk - Assesses how likely the vulnerability is to be exploited, considering factors like access levels, attack complexity, and known exploits.
Environmental Sensitivity - Measures the impact of the vulnerability in the specific application context, including whether the system is public, live, or has specific configuration details like dependency tracking.
Risk Attribution
The new Attribution feature enables ASPM risks to be assigned to specific users and/or groups, in order to ensure that the responsible party is aware of the need for remediation. The assignment is done via the Application Risk Management screen. When attribution is assigned, each assignee receives an email notification about the attribution with a link to view the assigned vulnerabilities in the platform. Attribution is also shown in a new column that was added to the Risk Management screen.
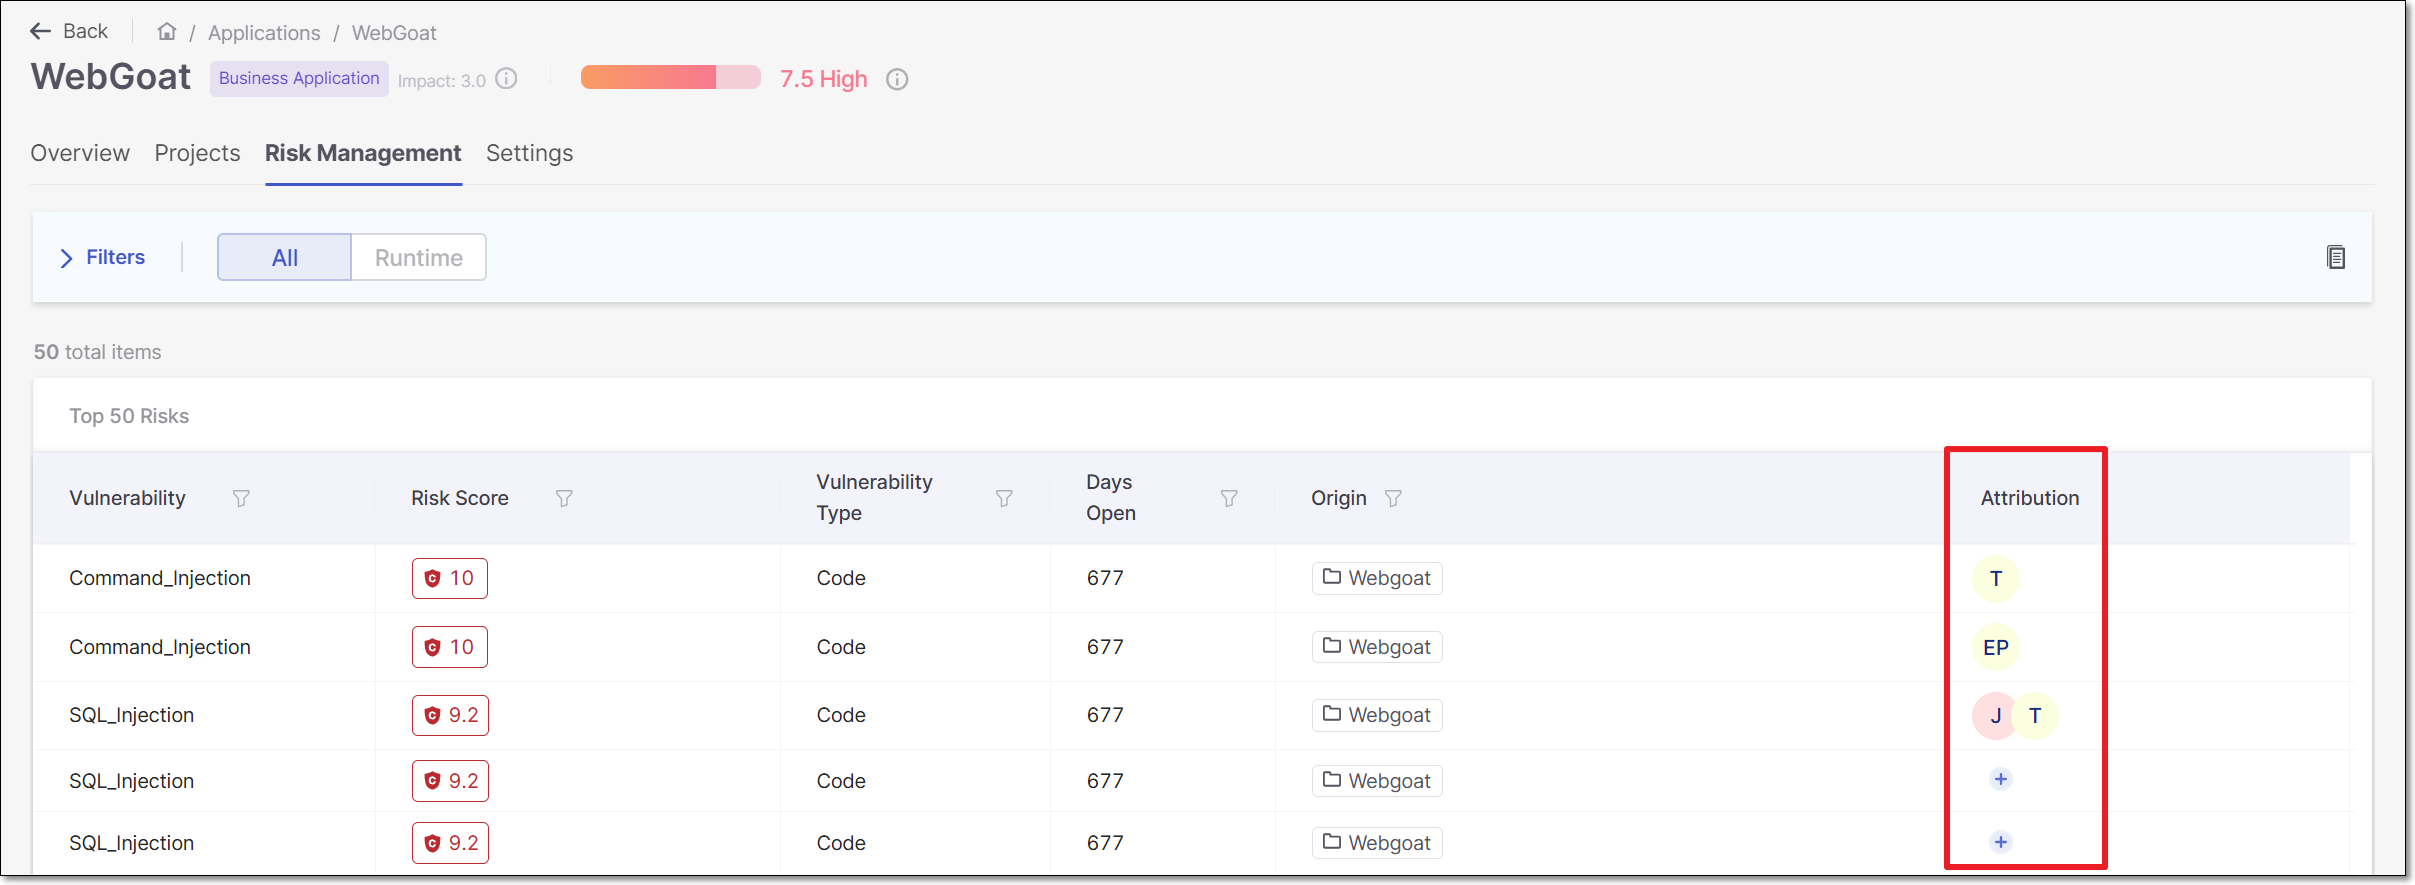 |
The  icon is shown in the Attribution column for risks that have not yet been attributed. For risks that have already been attributed, the icon is displayed when hovering over the attribution column of that row. Click on the icon to create or change an Attribution.
On the Applications Risk Management page, locate the vulnerability you want to assign and click the
icon in the Attribution column for that row.The Manage Assignees side panel is displayed.
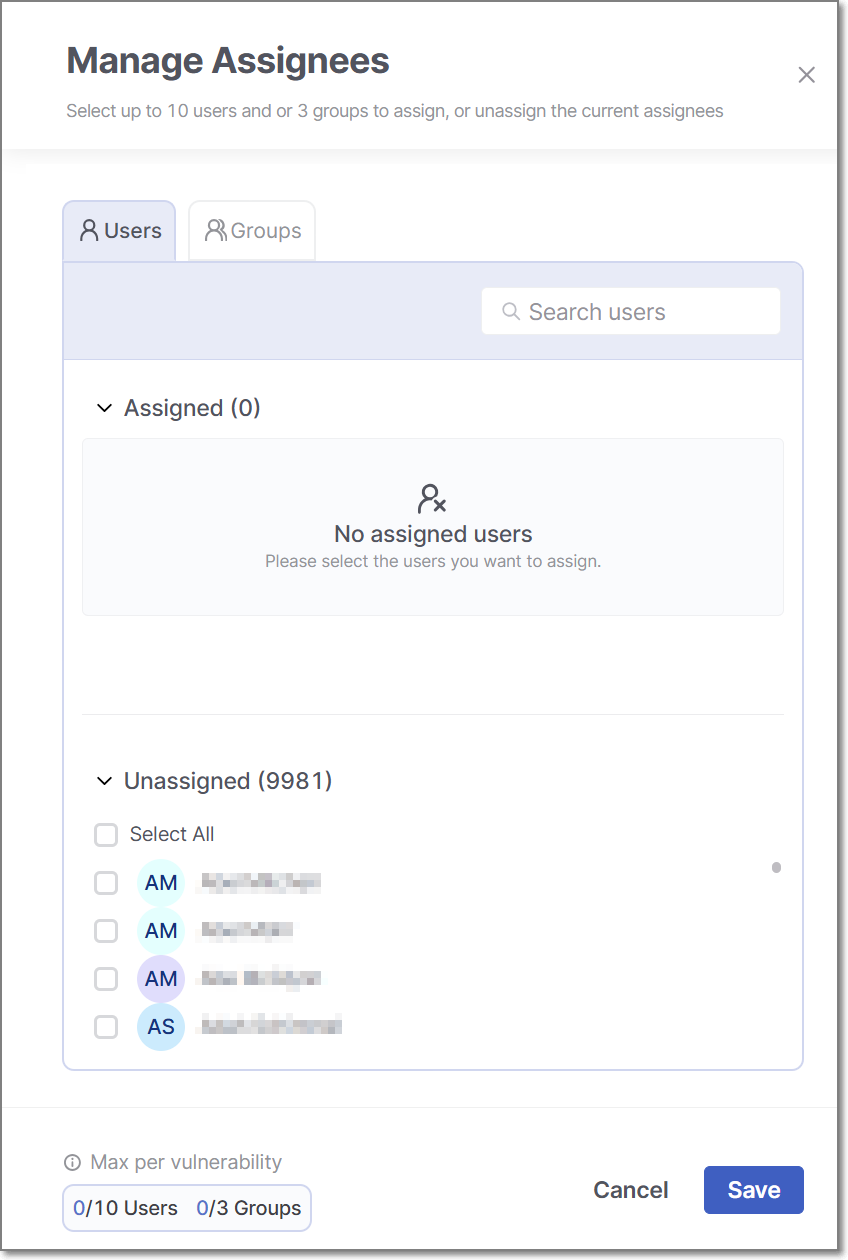
The panel includes two sections, Assigned and Unassigned. Both sections are collapsable to enable easier viewing.
From the Unassigned section, add users to the Assigned list:
To add an individual user, hover over a user and click the Assign button that appears next to their name.
To bulk-add a selection of users, select the checkboxes for the users you want to assign, then click the Assign button that appears at the top right of the list.
Note
The lists are searchable to enable you to find a specific user or group for attribution. A user that is not enabled or that does not have an active email will not appear on the list of unnasigned users available for attribution.
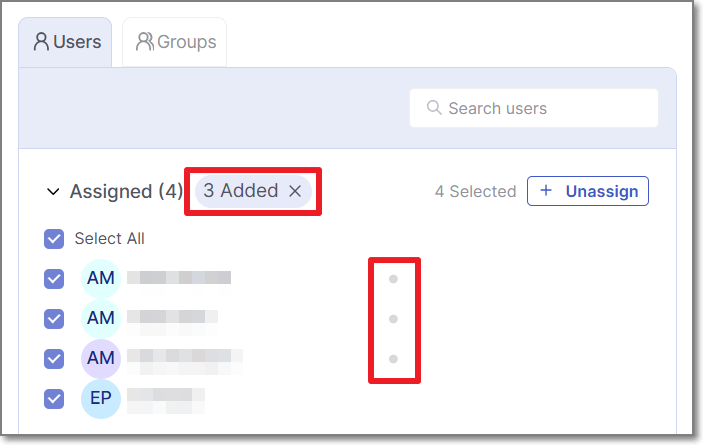
Users are now tentatively added to the Assigned list. New assignees will appear at the top of the list with a gray dot next to their name indicating that they have not yet been saved to the list. A corresponding gray text block appears at the top of the list with the number of pending assignees.
Note
Before saving, you can cancel the attribution of all new assignees by clicking on the X in the gray text block at the top of the list.
To assign groups. click on the Groups tab at the top left of the panel. You can add individual groups or bulk-add a selection of groups using the same procedure as was described for adding users in step 2.
Click Save.
The selected users and groups are now assigned and are displayed in the Attribution column of the vulnerability. Each assignee receives an email notification about the attribution with a link to view the assigned vulnerabilities in the platform.
Tip
The maximum number of users that can be assigned to a specific risk is ten. The maximum number of groups that can be assigned to a specific risk is three. When the maximum is reached, the Assign buttons will be grayed out and hovering over them displays a tooltip explaining that the maximum has been reached.
Identifying the Author (from git blame)
When the "Author" information is available (extracted via "git blame"), the Attribution column also shows the Author of the relevant code and the associated email. This information can be helpful for determining the appropriate attribution.
When present, the author icon appears first in the Attribution column, before the icons of the assignees. Hovering over it displays the author’s email.
Note
Author information is available only for SAST and IaC scan results.
The following API exposes this information through the author field: GET api/risk-management/{id}/results