- Checkmarx Documentation
- Checkmarx SAST
- SAST User Guide
- The CxSAST Web Interface
- Getting to Know the System Dashboard
Getting to Know the System Dashboard
Overview
The CxSAST web interface includes drop-down navigation menus for each relevant module, as follows:
 |
Notice
Visual indicators are displayed just underneath the Checkmarx logo/version and may include:
Type of product edition currently installed - SDLC or Security Gate
Expiry date of the current CxSAST license. The indicator appears 90 days (defined in the DB) before the actual license expiry date and, if defined, an email notification is automatically sent to the CxSAST System Administrator.
The Services & Support button allows CxSAST users to navigate to available support resources on our new Checkmarx Customer Center portal. This portal enables the option to open tickets and also provides access to useful Checkmarx links.
CxSAST web interface menu items are described below.
Projects and Scans
View projects scans and queues:
Create New Project: Starts the New Project wizard.
The Queue: View statuses of currently running scans.
Projects: All projects configured for groups in which the logged-on user is a member.
All Scans: Existing scan results of projects configured for groups in which the logged-on user is a member.
Settings
Manage Scan and Application settings:
Scan Settings:
Query Viewer: View and manage queries used in the system.
Preset Manager: Create and manage sets of queries according to your needs.
Pre & Post Scan Actions: Allows defining actions, based on preloaded scripts that will run prior or post scan.
Source Control Users: View and modify details of user accounts for accessing source control repositories.
Application Settings:
General: Folder locations, SMTP, and other settings.
OSA Settings: Organization token, OSA scan options and test connection settings.
License Details: The installed license details, including supported languages, roles, and number of companies and service providers.
Installation Information: Locations of server components.
External Services: Define settings for external services (e.g., Codebashing enablement).
Engine Management: Manage single/multiple engines.
Data Retention: Set the requested policy for deleting scans from all projects in the system.
Issue Tracking Settings: Configure issue tracking.
Manage Custom Fields:
Manage Custom Fields: Define project attributes (metadata) by using custom fields
Access Control
Manage teams, users, roles and access control settings.
Management & Orchestration
Policy Manager: Manage policies
Policy Violations: View policy violations
Remediation Intelligence: Manage remediation intelligence weight and rank settings
Analytics: View analytics results
Codebashing
Codebashing in-context eLearning platform. Codebashing is fully integrated into Checkmarx SAST so when developers encounter a security vulnerability they can activate the appropriate learning module with a single click. Once they have run through the hands-on training they get straight back to work equipped with the new knowledge to resolve the problem.
Services and Support
Checkmarx customer center with ticketing capabilities, access to the Checkmarx knowledge center, and useful links to plugins, utilities, and version updates.
Dashboard Menu
As a manager (Server, Company or Service Provider manager) you can view high-level information such as the state of your projects, scan status, utilization, and risk and data analysis in the Dashboard Menu.
To enter the Dashboard Menu click Dashboard and select the relevant sub-menu.
Project State
The Project State window displays the status of all current projects.
To display the Project State window, go to Dashboard > Project State.
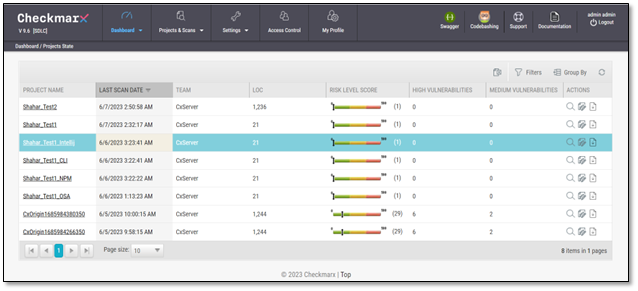
The Project State window includes the following information:
Project Name click on the Project Name link to view the Consolidated Project State
Last Scan Date includes the date and time of the scan in M/D/Y; HH:MM:SS
Team
LOC
Risk Level Score
Vulnerabilities (High, Medium, Low, Info and Total)
Last Update
Queue Time
Scan Time
Actions (
 View results,
  Create report,
  Download scan logs)
You can Export as CSV File  , use the
  Filter and
  Group By tools as well as
  Refresh the current view.
Notice
Projects that have not yet had scans performed on them are displayed in the Project State window with the "No SAST Scans performed" message.
Failed Scans
The failed scans window displays the status of all failed scans.
To display the Failed Scans window, go to Dashboard > Failed Scans.
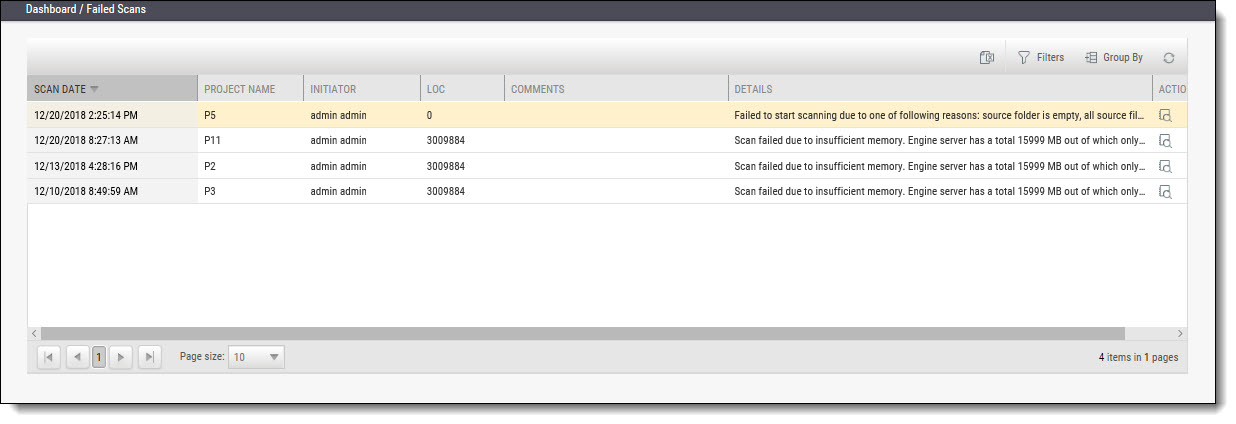 |
The Failed Scans window includes the following information:
Scan Date
Project Name includes a link that redirects to the respective Projects State page
Initiator
Team
LOC
Comments (as in The Queue (v8.9.0 to v9.3.0))
Details
Actions (
 Download scan logs)
You can  Export as CSV File, use the
  Filter and
  Group By tools as well as
  Refresh the current view.
Utilization
The Utilization window displays the status of all completed and running scans.
To display the Utilization window, Go to Dashboard > Utilization.
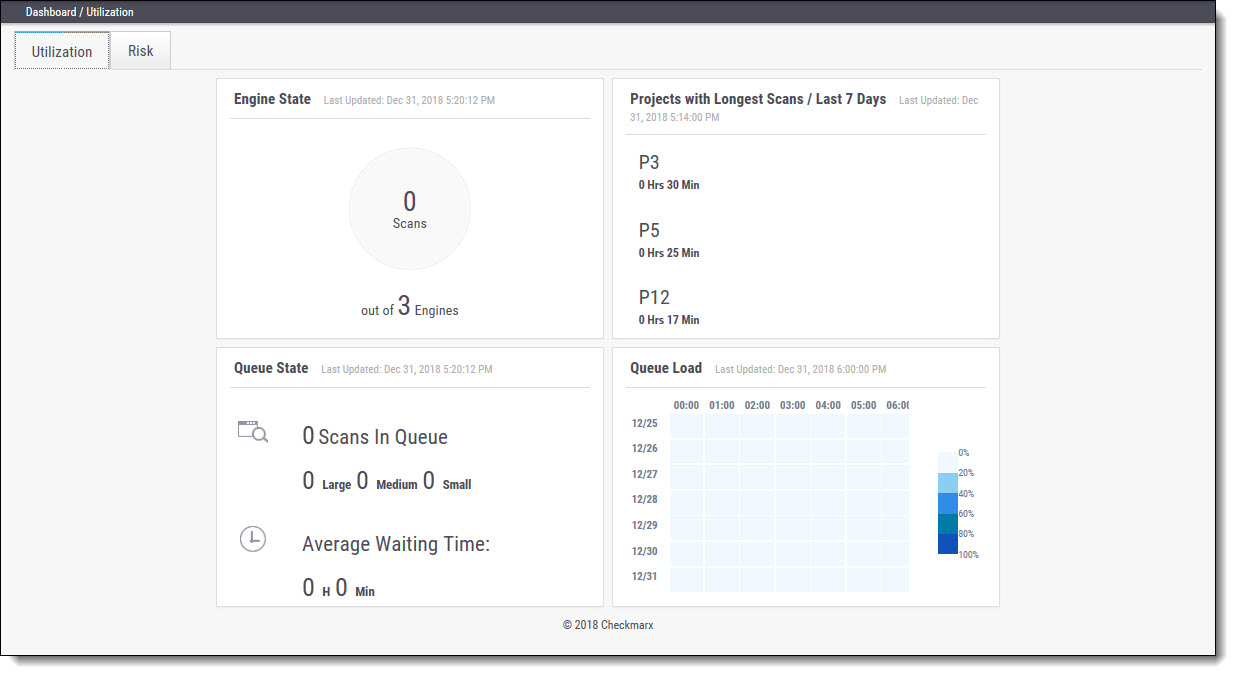 |
The Utilization window includes the following information:
Engine State - number of scans to engine ratio
Queue State - number of scans in the queue and their LOC size / average waiting time
Projects with Longest Scans - top 3 scans in the longest waiting time category
Queue Load - queue load over a 7 day period:
The darker the blue the more in the queue
Empty cell with the black outline indicates currently running queue
Each widget in the Utilization window includes a time-stamp indicating the last date and time the data was last updated.
Risk State
The Risk State window displays the number of vulnerabilities and the risk score for each project.
To display the Risk State window, go to Dashboard > Risk State.
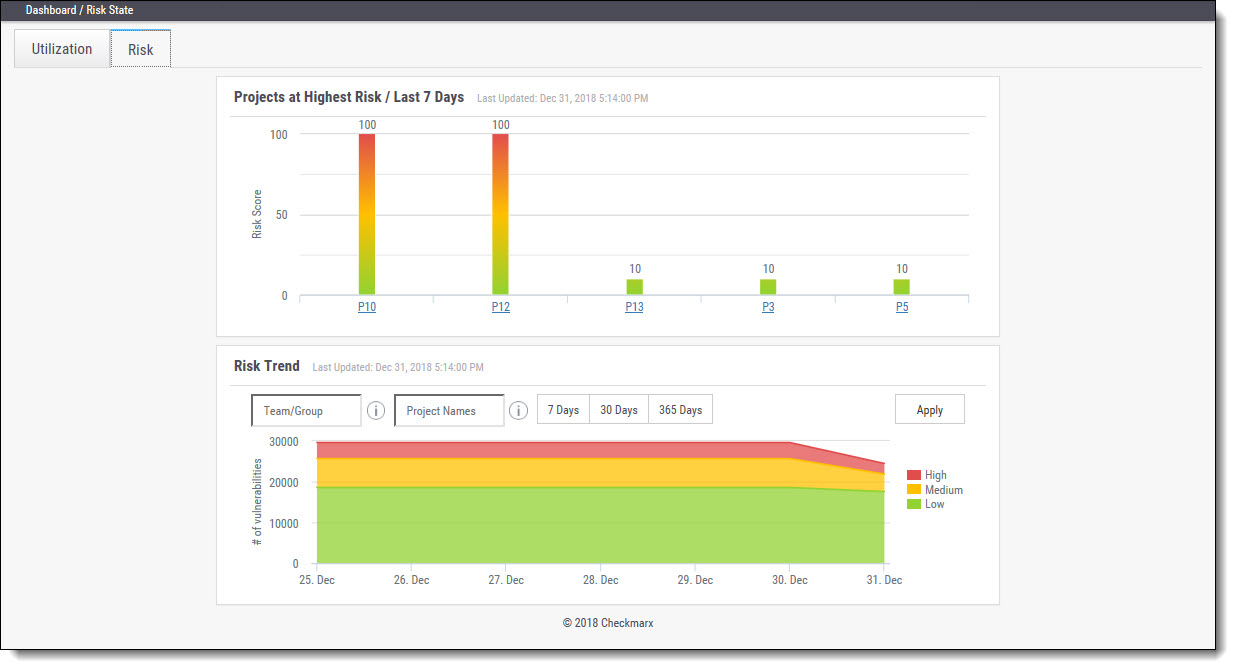 |
The Risk State window includes the following information:
Projects at Highest Risk / Last 7 Days - risk score for each project by filtering option
Risk Trend - number of vulnerabilities by filtering option
You can filter by Team/Group, Project Name and Number of Days. Click <Apply> to confirm.
Roll-over the graph to get the project risk and vulnerabilities scores according to date.
Click Project Name to view the Project State summary.
Click the legend to display/hide the respective vulnerabilities (High, Medium, Low).
Each widget in the Risk State window includes a time-stamp indicating the last date and time the data was last updated.
Data Analysis
The Data Analysis window displays a summary analysis of multiple projects. The data can be presented in several predefined configurations and you can also create your own tables.
To display the Data Analysis window, go to Dashboard > Data Analysis.
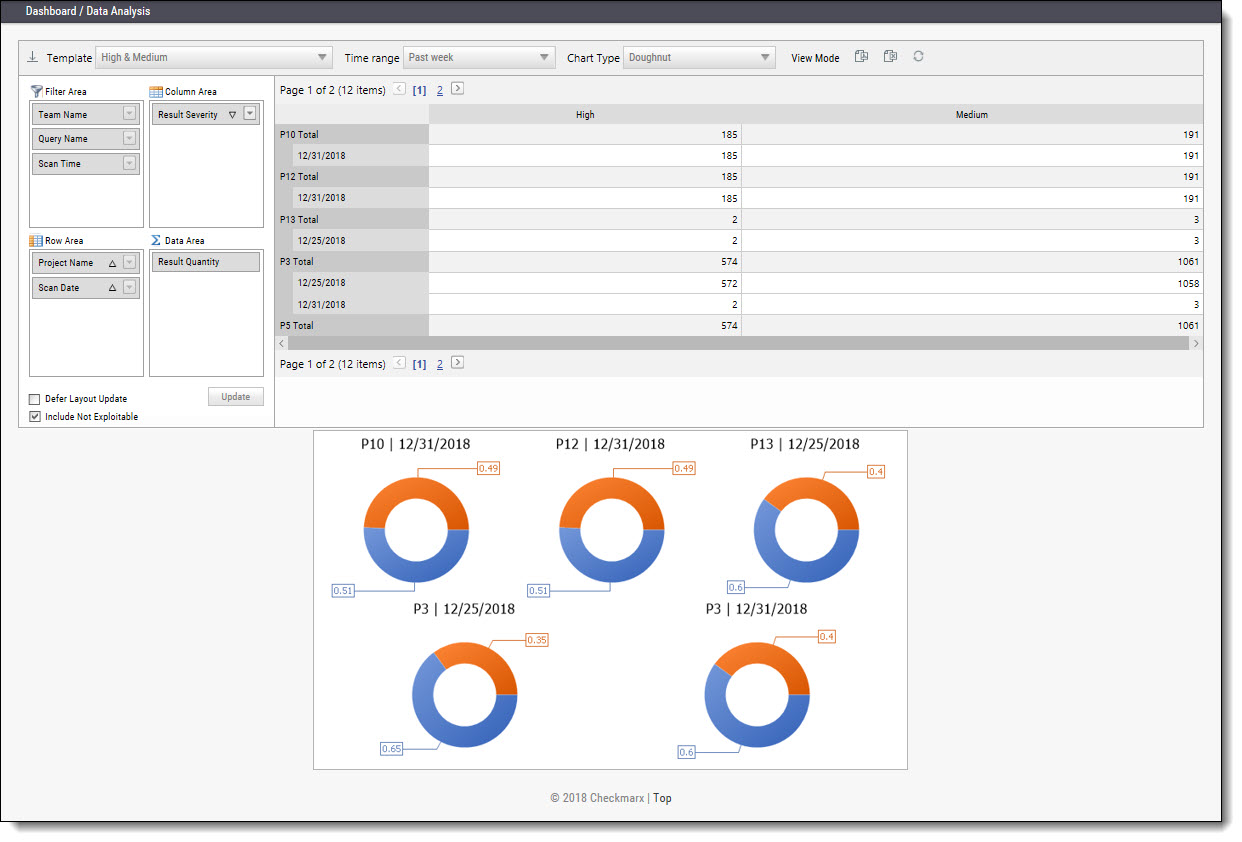 |
The data can be presented in several predefined configurations and you can also create your own tables.
In Template, select one of the following table configurations:
Project Status: Displays data for most recent projects
High & Medium: Displays data for projects with High or Medium severity
Last week OWASP Top 10: Displays all projects last week results for OWASP Top 10 queries
Basic: Create a pivot table from scratch. Drag and drop the relevant tab from Filter area to Column, Row or Data area
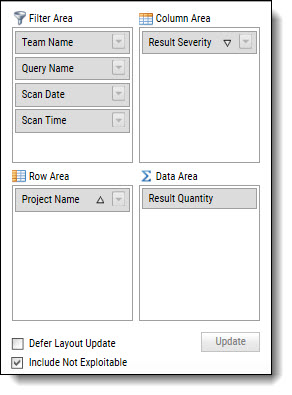 |
Filter parameters by selecting Defer Layout Update to disable filtering.
Decide whether to Include result instances that have been marked as Not Exploitable.
Use the top bar to alter the Chart Type, View Mode or to Export the chart and the table to PDF or Excel file.
 |
To save a custom table as a template, click <Save>.