- Checkmarx Documentation
- Checkmarx SAST
- SAST User Guide
- Working with Logs
- Analyzing Logs Using ELK
- Log Enhancements
Log Enhancements
The capabilities provided by the CxSAST structured logs have been extended with Kibana (ELK version 7.15.2).
The following dashboards are now available, improving troubleshooting efforts by providing more detailed information about the various phases of the scans, ultimately resulting in more efficient root cause analysis:
Log statistics per application component
Scan time duration per stage
For further information and instructions about import dashboard with Kibana, refer to Save Objects.
Log statistics per application component
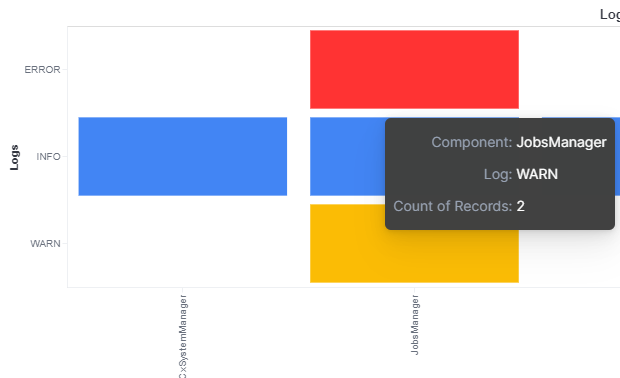
This dashboard displays the number of log messages organized according to the type of severity of the message and the application component.
The following components are included in this dashboard:
CxSystemManager
JobsManager
ResultService
ScanManager
WebAPI
WebService
The following log message severities are displayed: INFO TRACE DEBUG WARN ERROR FATAL
An example of the dashboard is shown below.
 |
When you hover over a block in the dashboard, the total number of messages for the selected component and severity is displayed, as shown below.
 |
Scan time duration per stage
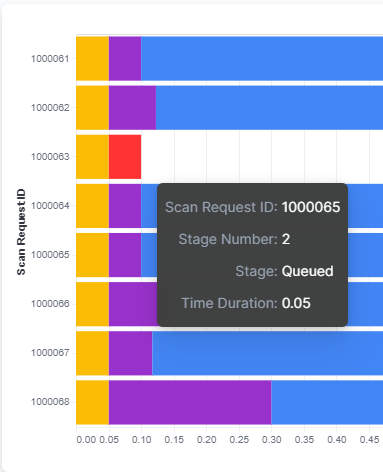
This dashboard allows you to quickly visually compare the scan time duration of different scans. In addition, you can compare the duration of the scan stages for different scans. The dashboard is built by aggregating the range of different Scan Request IDs on the y-axis, and the time duration (in minutes) on the x-axis.
The scan time duration is represented by a bar, split and color-coded into the following stages of the scan:
Source Pulling and Deployment
Queued
Scanning
Finished
Failed (if applicable)
An example of a set of scan time representation bars is shown below.
 |
When you hover over each stage, the time duration for the scan stage is displayed, as shown below.
 |
For the scenarios where the load of the scan is high, another dashboard is available, reducing the scope of the data to the last three scans, such as shown below.
 |