- Checkmarx Documentation
- Checkmarx SAST
- SAST User Guide
- Scan Results
- Generating Scan Result Reports
Generating Scan Result Reports
You can generate a report containing detailed scan results in any of the following formats:
Important
All disclaimers footnoted in the reports should be understood in the following context: The report only includes the presets/filters you applied to the scan results.
PDF (default)
RTF
CSV
XML
To generate a scan results report:
1. In the All Scans table (for all projects or an individual project), click Create Report  . The report settings are displayed.
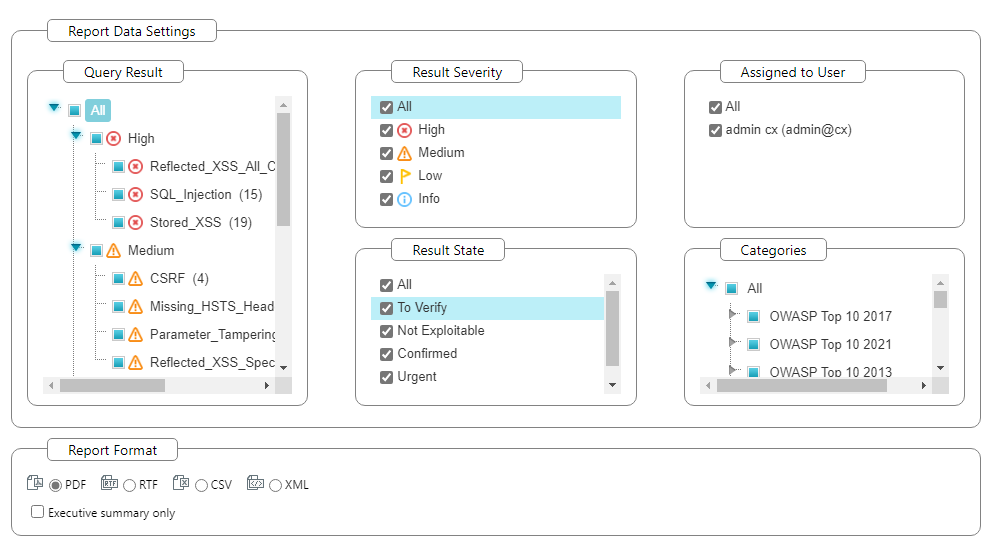 |
2. Filter the generated report's results and select the report file format. By default, all categories are selected to be included in the report.
To customize categories:
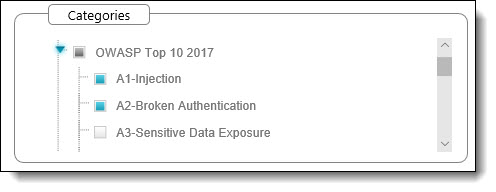
1. Go to the relevant group under the Categories section, click the group to expand it, and clear the vulnerabilities you do not want to display in the report, as shown below.
2. If these changes are only relevant for a specific need and do not need to be saved as a different template, click Generate to generate the report. Otherwise, follow the procedure below to save the modifications you make as an updated report template.
To change the report template:
1. Select Change template. The template settings are displayed.
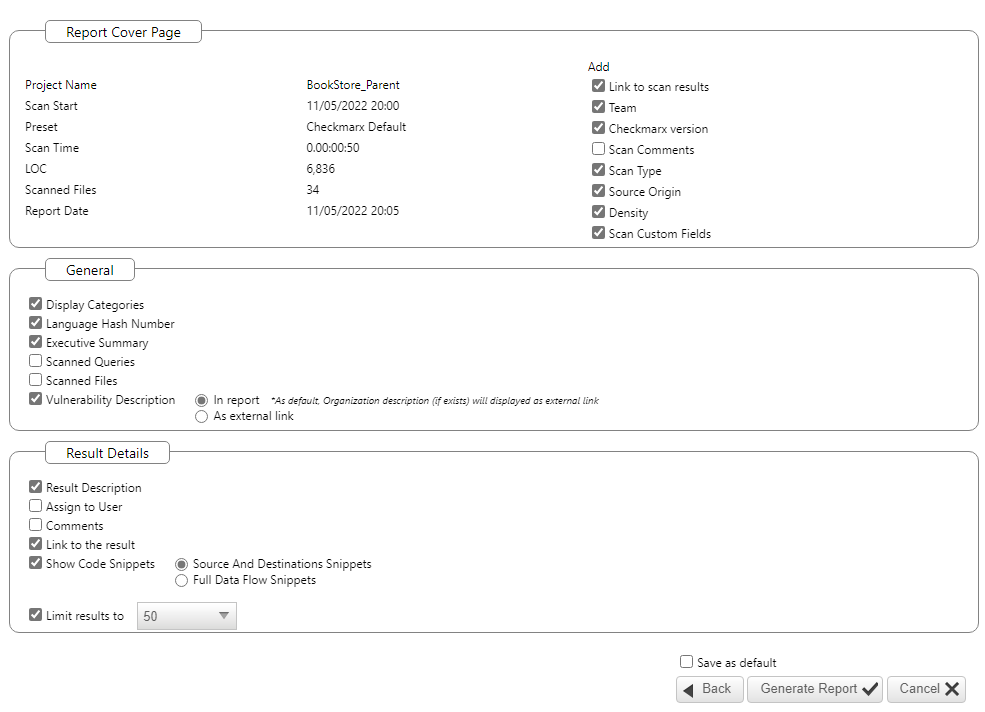 |
2.Select which details should be presented on the report cover page, in the report itself and what details to show for each result.
3.Select the Save as default check-box to save the modified template as the default report template.
(Click Back and review all settings you defined.)
4.Click Generate Report. The report starts generating.
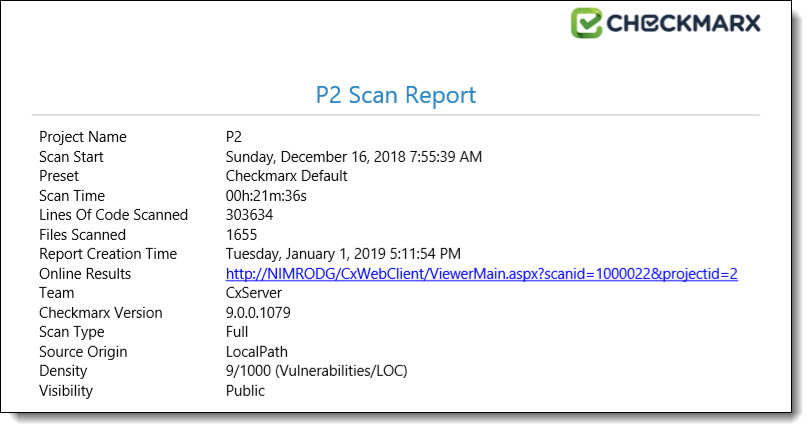
The details about the scan are displayed on the Scan Report section at the beginning of the PDF file, as shown below.
Notice
In cases where the project's source location is defined as Git, the Git branch information will also be included in the PDF report underneath the Source Origin field.
The exclusions that were made are displayed on the Filter Setting section, as shown below.
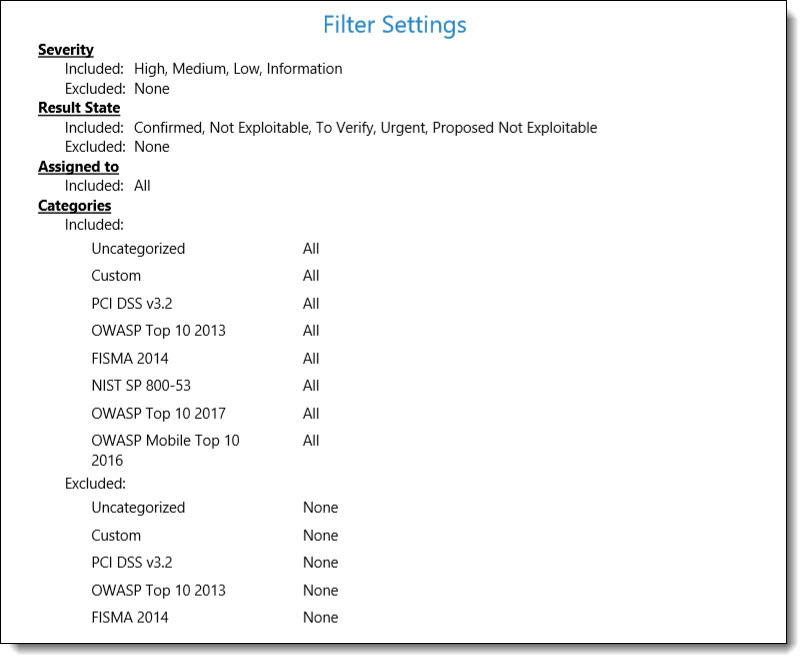
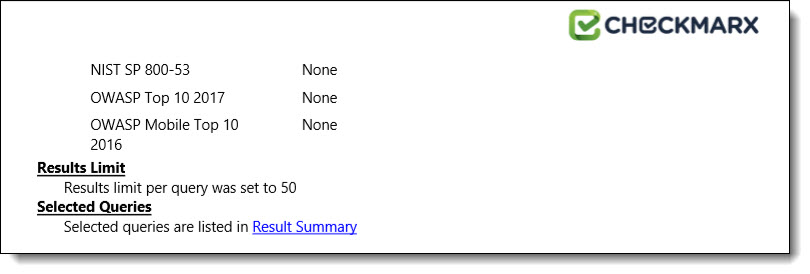
Parameters that were selected to be displayed will appear in the report even if none of these parameters (for example, OWASP A-6 category) were detected in the scan, in which case they will appear with the count "0".
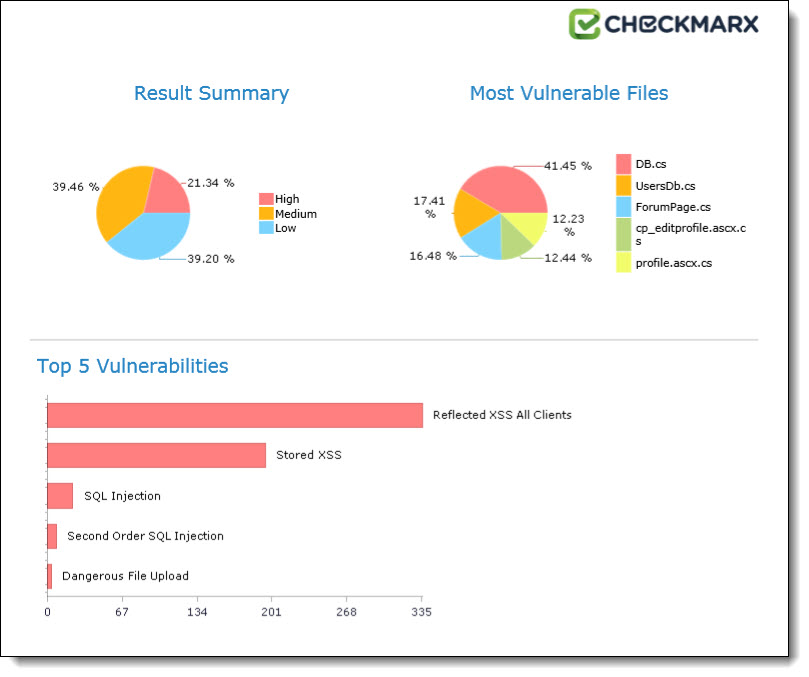
The OWASP (2017, 2013 & Mobile 2016), PCI, FISMA and NIST summary sections in the scan report include a column named Best Fix Locations, which indicates the number of locations in the flow map that have been found as the best locations to fix the issues that belong to the selected category (for example, A1-Injection).
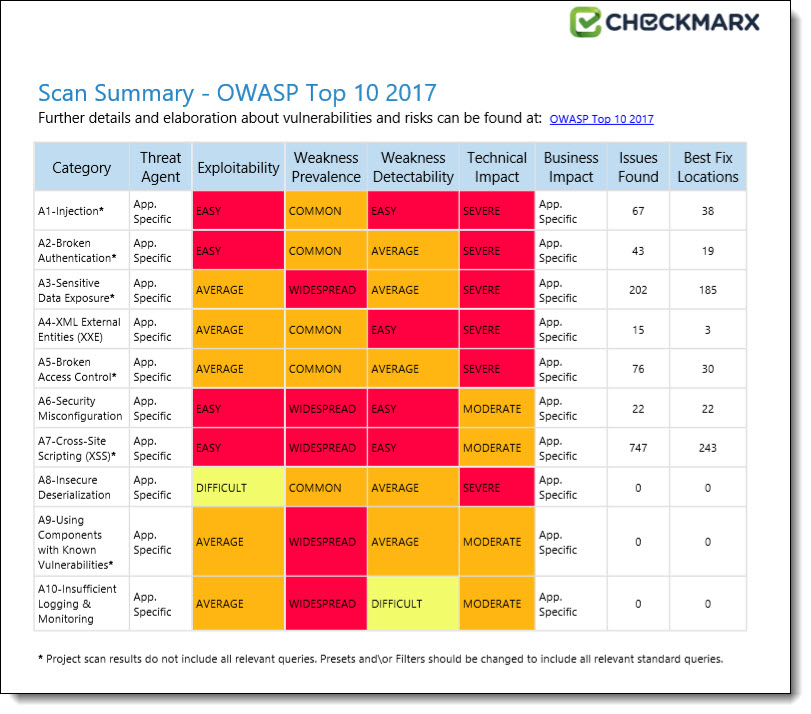
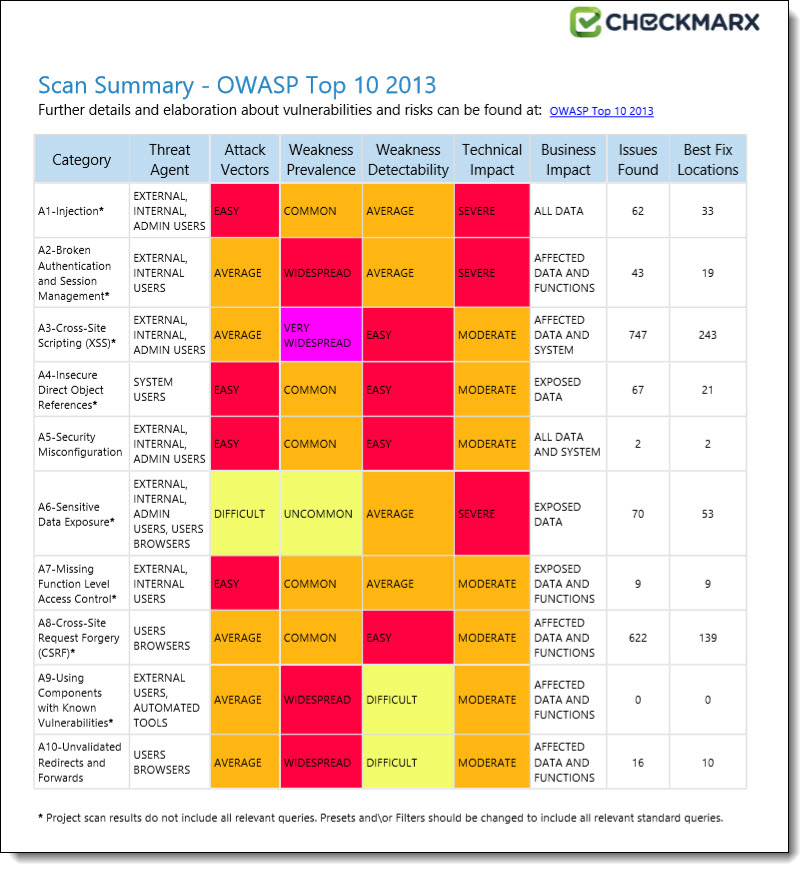
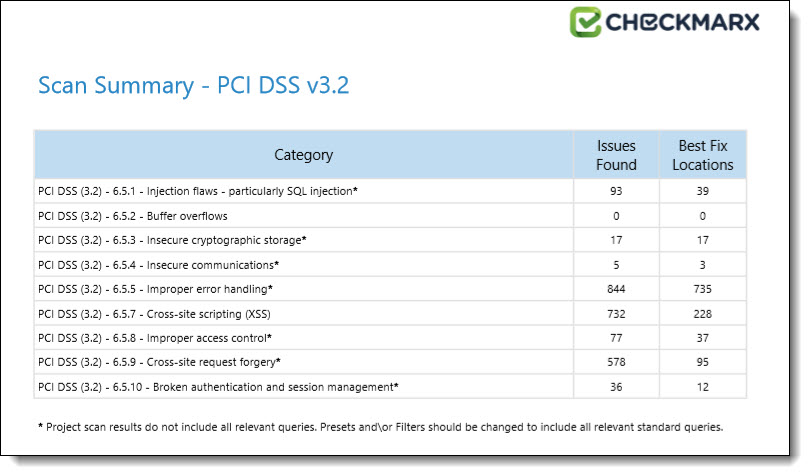
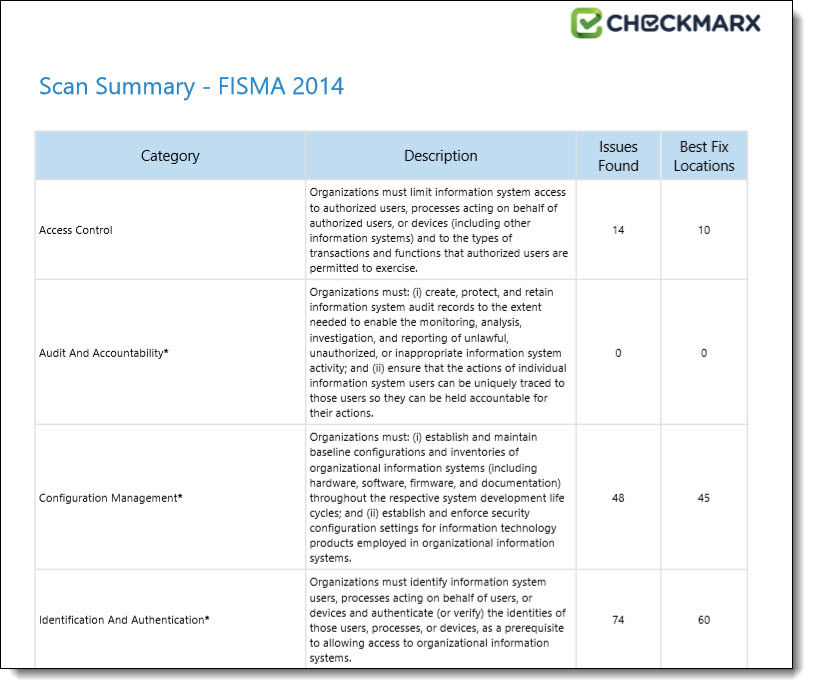
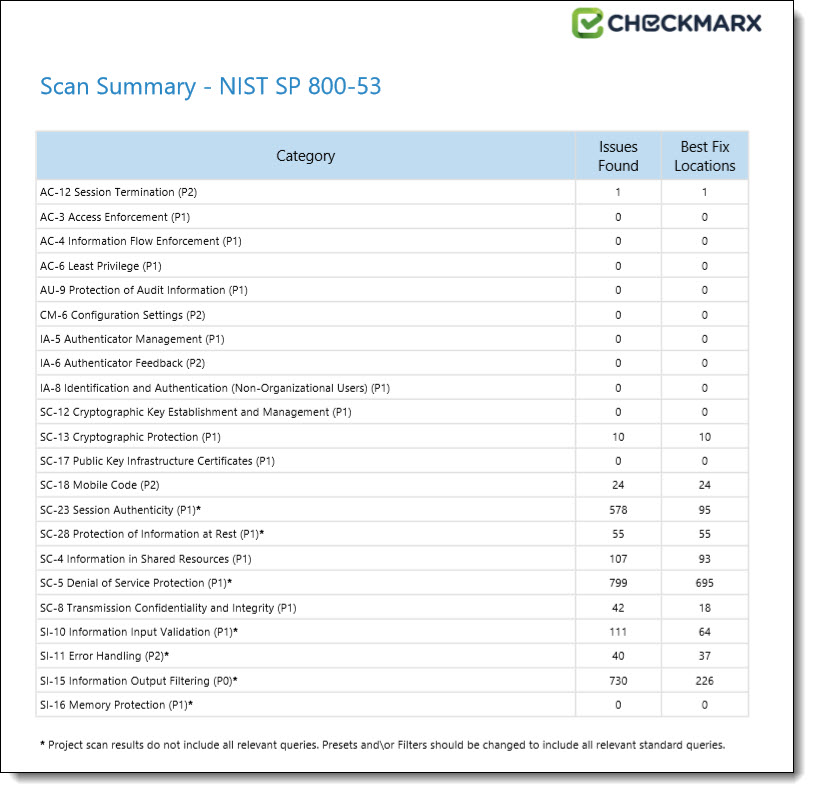
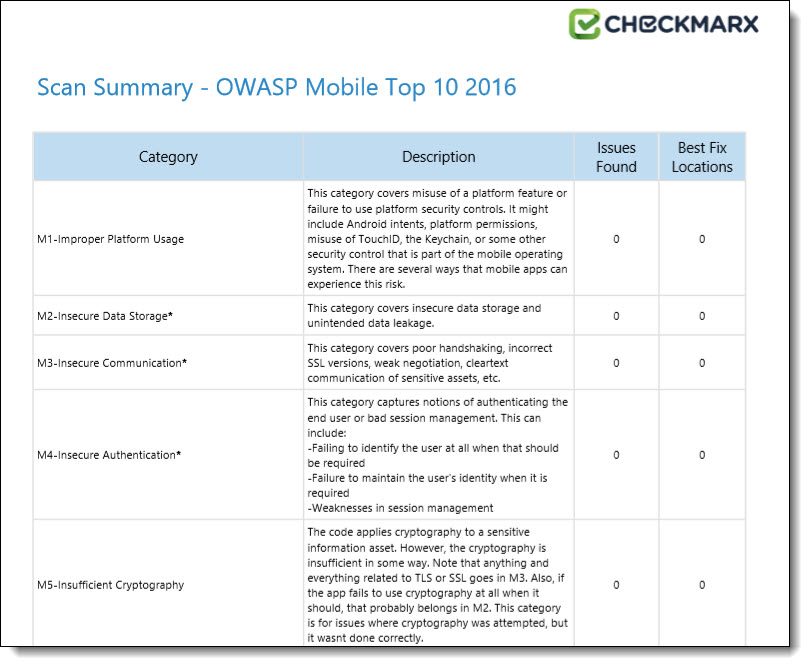
The Best Fixed Location is an absolute number that cannot be filtered and always displays all of the values. As a result, it is quite probable that while in effect the number of vulnerabilities far exceeds the number of best fix locations for a specified category (for example, 8000 and 600 respectively), the filtered report may display 350 issues and 300 best fix locations.
.CSV Report Results
The following is a basic description of the fields provided in the .csv report result, which is generated by the create report feature if the selected format is .csv:
SrcFileName – file name of the first node of the result
Line – line of the first node of the result
Column – column of the first node of the result
NodeId – internal id to be able to identify the query in the first node
Name – text of the first node of the result
DestFileName – file name of the last node of the result
DestLine – line of the last node of the result
DestColumn – column of the last node of the result
DestNodeId – internal id to be able to identify the query in the last node
DestName – text of the last node of the result