- Checkmarx Documentation
- Checkmarx SAST
- SAST User Guide
- Working with Logs
- Viewing Structured Logs Using Kibana
Viewing Structured Logs Using Kibana
Structured Checkmarx SAST log data can be uploaded to Kibana. Using Kibana you can analyze and display the log data and create customized dashboards.
Prerequisites
In the SAST database, enable the SPLIT_MESSAGE_WITH_MULTIPLE_LINES_TO_MULTIPLE_MESSAGES option in the EngineConfiguration table, by using the following command:
UPDATE [CxDB].[Config].[CxEngineConfigurationKeysMeta] SET [DefaultValue] = 'true' WHERE [KeyName] = 'SPLIT_MESSAGE_WITH_MULTIPLE_LINES_TO_MULTIPLE_MESSAGES'
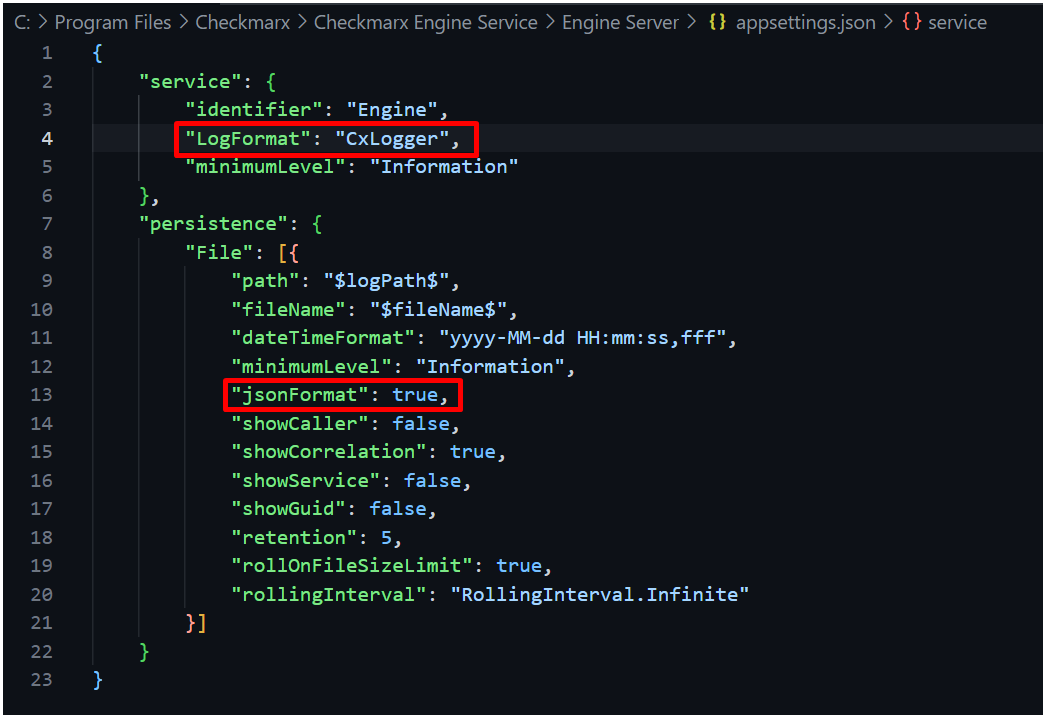
Configure the Checkmarx logs so they are displayed in a structured format, by ensuring that the appsettings.json file looks similar to the following:
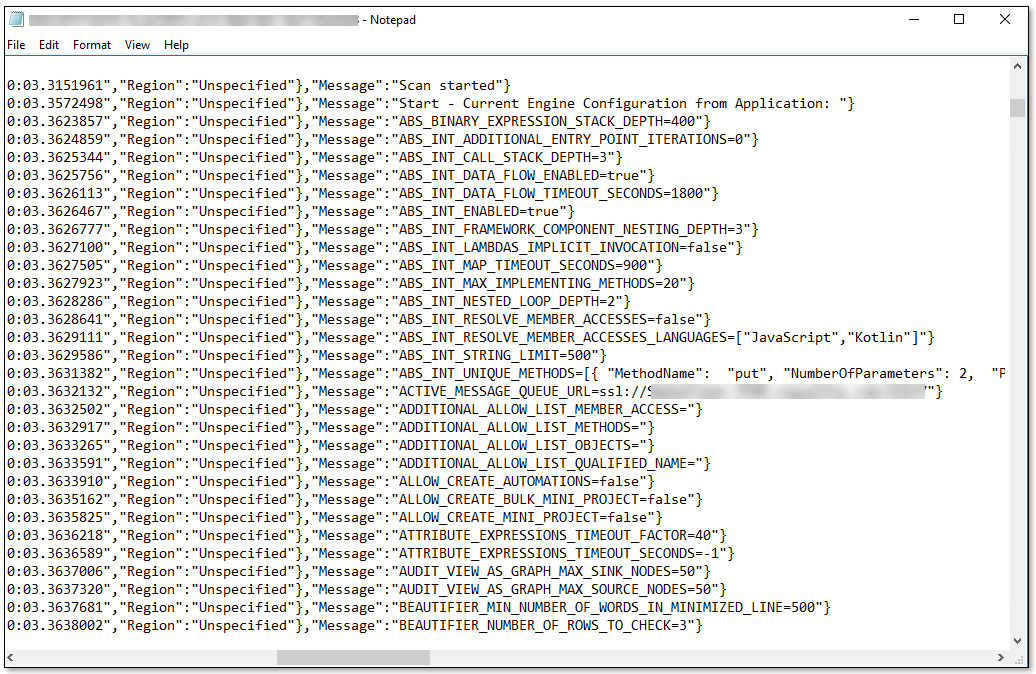
Then the log output will be displayed in a structured format, similar to the following:
Ensure that Elastic Search and Kibana are installed and configured.
For more information, refer to the Elasticsearch and Kibana installation instructions.
Uploading log files to Kibana
Upload the Checkmarx log file, such as EngineScanLog, to Kibana.
Save the log file as a data source.
Open the index in the Discover view.
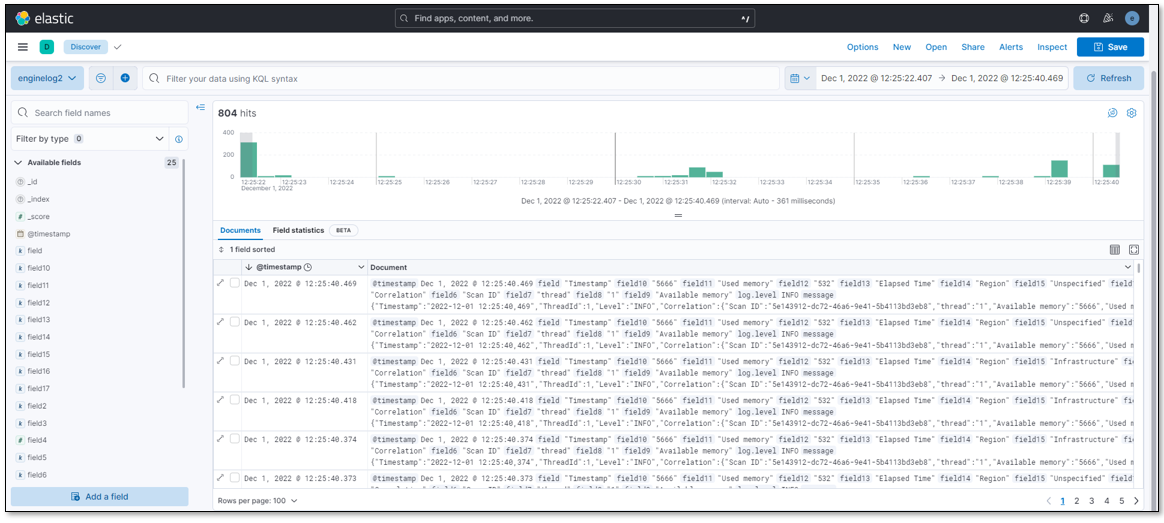
Select your saved source. The log information is displayed similar to the following screenshot:
Querying information using the Kibana Query Language (KQL)
In the Discover view, select your source.
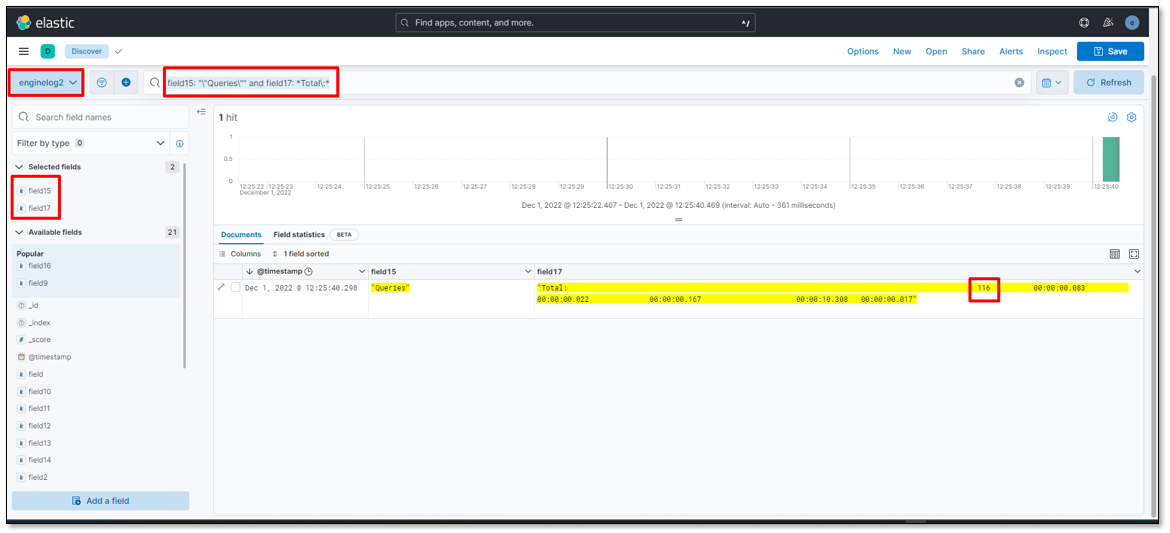
In the filter field, enter a custom KQL syntax query. For example, to display sample engine query total results, enter the following syntax:
field15: "\"Queries\"" and field17: *Total\:*
The results of the query is shown below:
Creating dashboards
In the Dashboard view, create graphic visualizations of the log data that you want to display. For example, you can create a donut chart to view log level distribution.
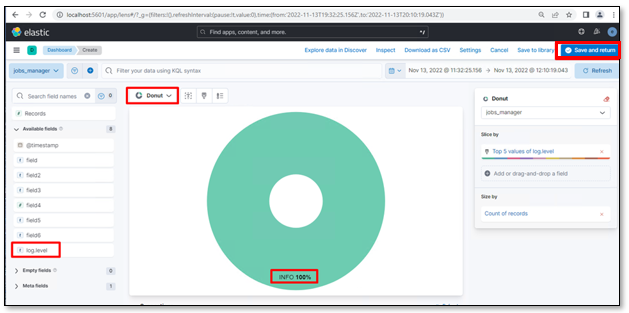
You can add several graphic visualizations to your dashboard.
Save your dashboard.
Managing objects
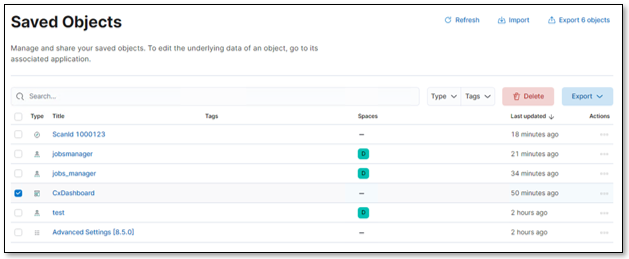
You can manage and share your saved objects, using the following panel:
 |