- Checkmarx Documentation
- Checkmarx One
- Checkmarx One User Guide
- Viewing Scan Results in the Results Viewers
- API Security Results Viewer
API Security Results Viewer
The API Security Result page contains a list of risks, the Risks table, which can be sorted according to the parameters listed in that table. Additional information on these parameters is available under Viewing the Scanners Tab (API Security).
 Severity
Risk Name
Status
Endpoint Path
Method
Data Origin
Risk Discovered
Risks Table
The table illustrated below lists all the API security risks detected during the recent scans.
To view the Risks table from the Project Preview:
Under Projects and Applications, In the Projects list, click somewhere in the line of the desired project. The Project Preview appears.
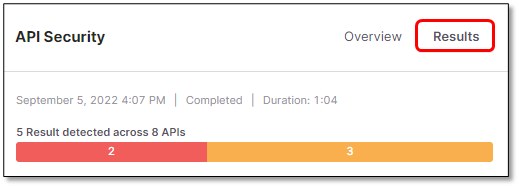
In the Projects Preview, click
 for the desired scanner, in this case API Security. The Risks table appears as illustrated below.
To view the Risks table from the Project Overview:
Open the Project Overview, for example by clicking
 in the Project Preview.
In the Project Overview, click
 . The Risks table appears with the scan results. This example reflects the results illustrated on the scanners tab page listed in the Risks table.
Viewing Scan Results in Detail
This section explains how to view the scan results and what you see. For every detected risk, the risk itself (for example a privacy violation) and a list of sensitive data that appear in the code are displayed. The sensitive data is a set of parameters in various categories that have been defined as sensitive data by Checkmarx.
Notice
The list of sensitive data is not related to the detected vulnerabilities. It simply provides you with an overview of what is potentially vulnerable to threats.
To display the details of the detected risk and a list of sensitive data in the code:
Click the row of the respective risk, for example
 Privacy Violation. The Details and Parameters widgets appear with information on the detected risk and the sensitive parameters in the code.
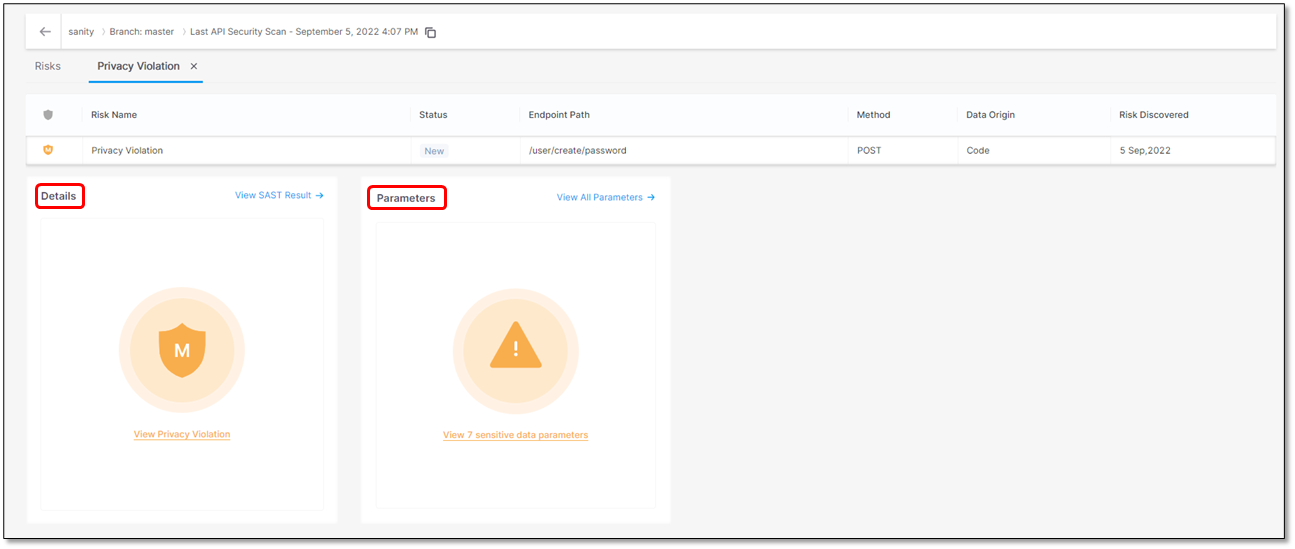
Click somewhere inside the Details and Parameters widgets. Further information on the risk and a list of sensitive data in the code and their location appear.
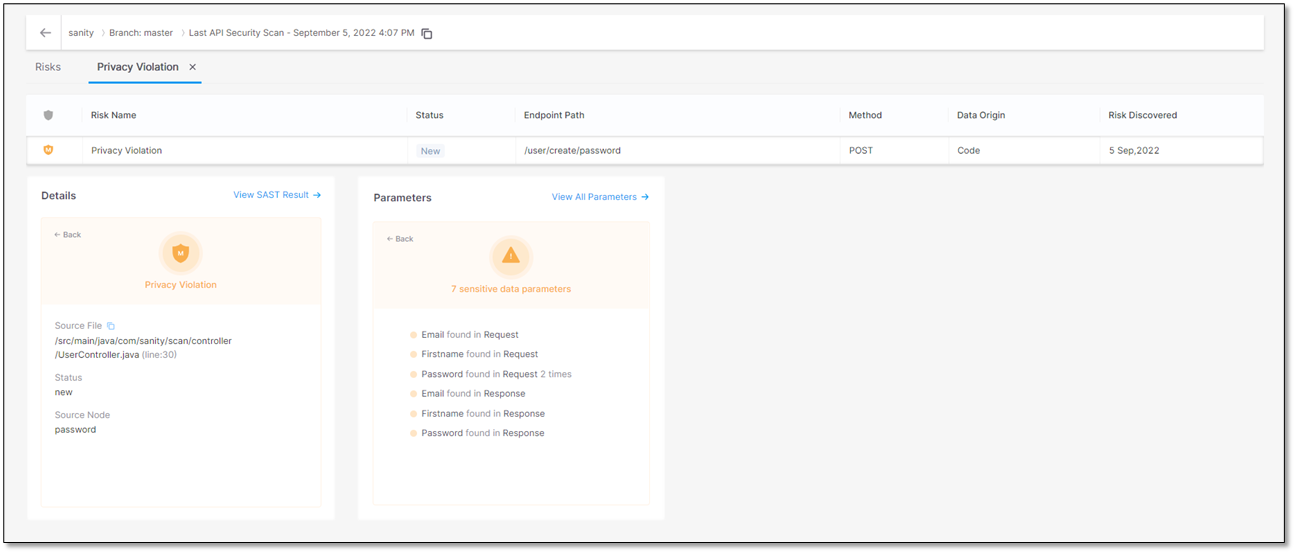
To get more information, refer to the next sections on this page.
To view the details on the detected risk:
Click somewhere in the Details widget to view additional information on the detected risk. The table below lists and explains where the risk is located. The risk in this example is a Privacy Violation.
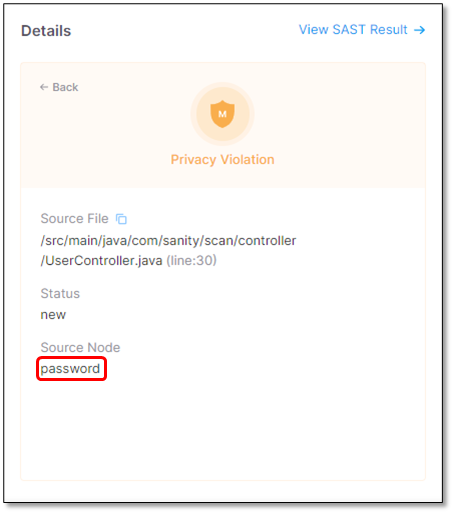
Parameter
Value
Description
Source File
/src/main/java/com/sanity/scan/controller/UserController.java(line:30)
The path and file name of the file with the Privacy Violation.
Status
New
Recurrent. The vulnerability has been detected at least once before.
The status of the privacy violation
Source Node
The first node (input) of the vulnerable sequence.
The beginning of the attack vector.
To view all the SAST scan results around the detected risk:
In the Details widget, click
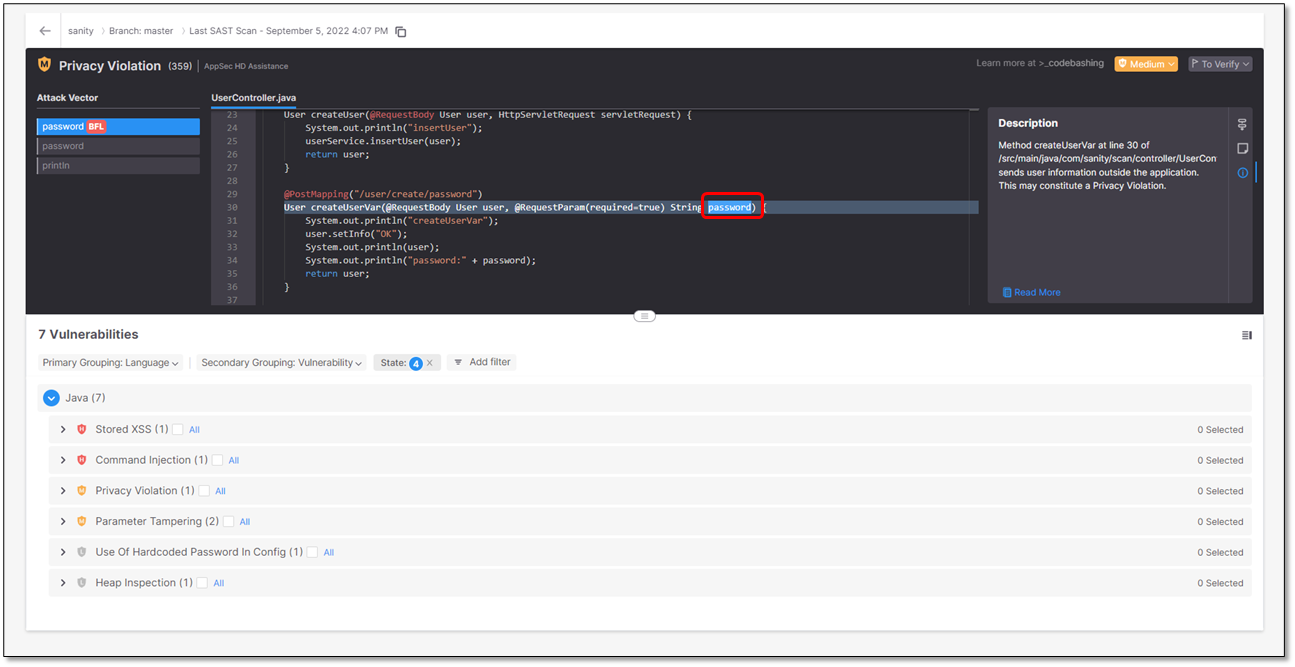
 . A list of SAST vulnerabilities appears. In this example, 7 Java vulnerabilities have been detected.
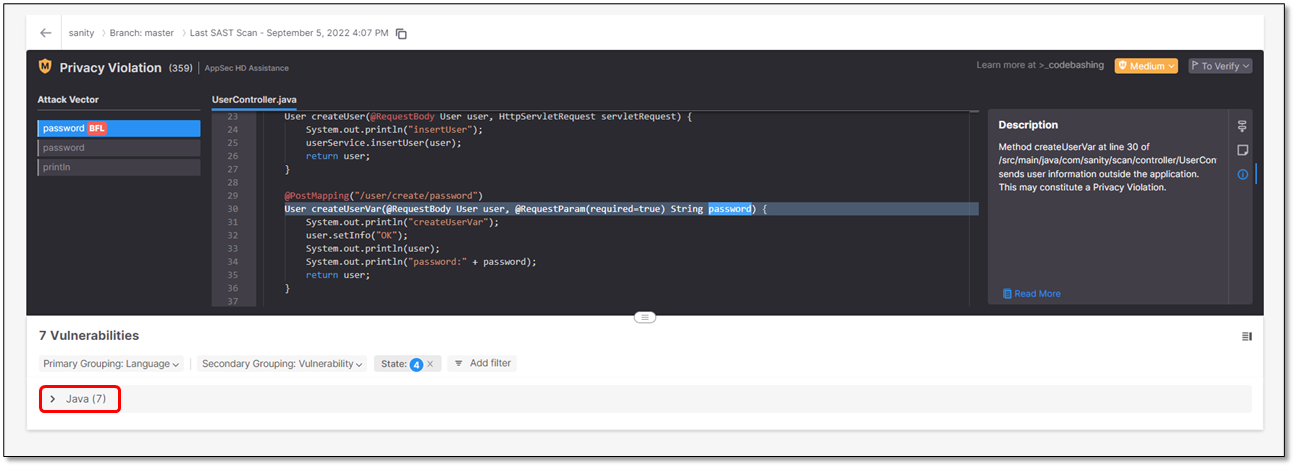
Expand the list by clicking
 .
.
Expand a vulnerability. The vulnerability appears listed with additional information.
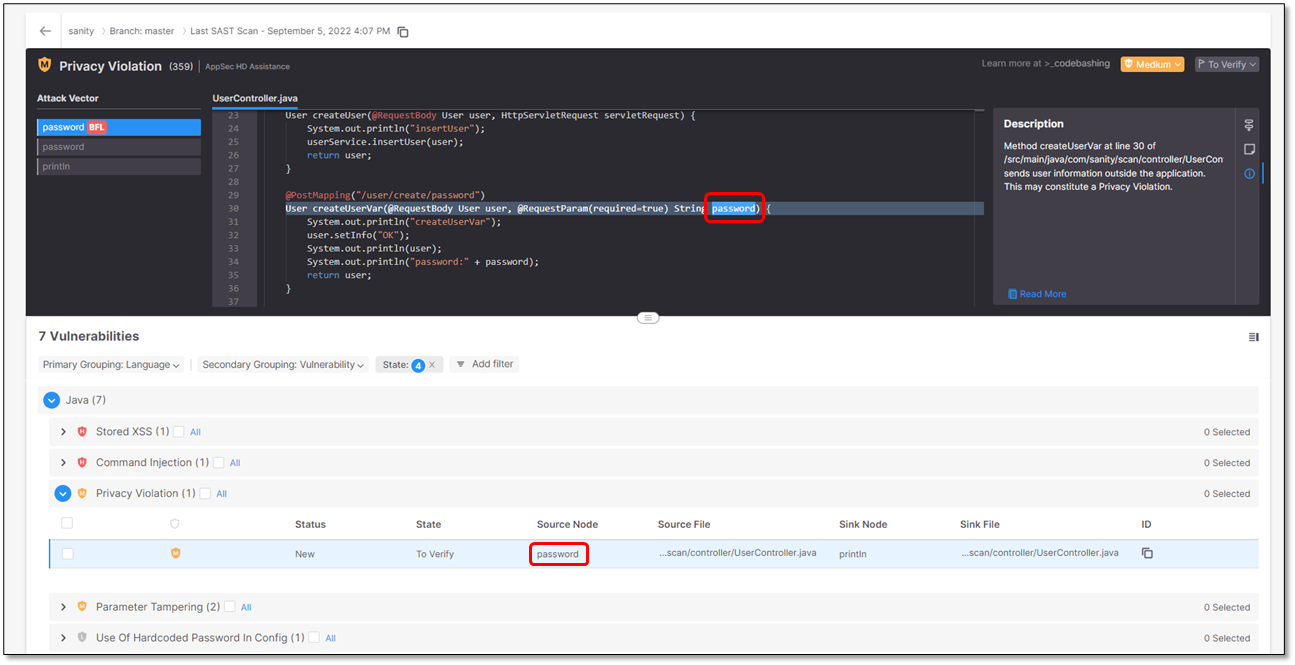
Parameter
Description
 (Severity)
Severity of the vulnerability:
 Critical
 High
High Medium
 Low
LowStatus
Status of the vulnerability:
New
Recurrent - The vulnerability has been detected at least once before.
State
To Verify - Vulnerability requires verification, for example, by an authorized user.
Confirmed - Vulnerability has been confirmed as exploitable and requires handling.
Source Node
The first node (input) of the vulnerable sequence.
Source File
The file in which the source node is located.
Sink Node
The last node (output) of the vulnerable sequence.
Note
For vulnerabilities that affect a single node, the sink node is identical to the source node.
Sink File
The file in which the sink node is located.
ID
To read the vulnerability ID, hover over
 .
.To copy the ID into the clipboard, click on
 .
.Expand a vulnerability and click inside the line that details it. A table with further information on that vulnerability appears and the exact location in the code is displayed.

In addition, a short description of the vulnerability is provided. For a more detailed explanation, click Read More. A more detailed description opens in a new tab of your browser.
To view a list of the sensitive data parameters in the code:
Click somewhere in the Parameters widget. All the sensitive data in the code appears listed with its location
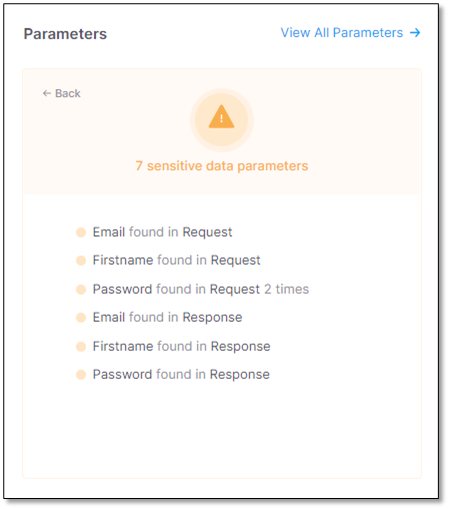
Under Parameters, click
 . A list with the sensitive data parameters appears as outlined in the table below.
Interface
Description
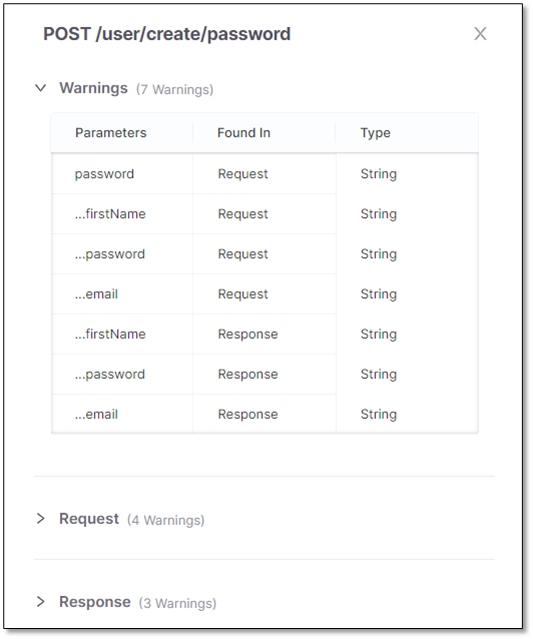
List of all sensitive parameters in the API with warnings. This section is identical with the list of the sensitive data parameters above.
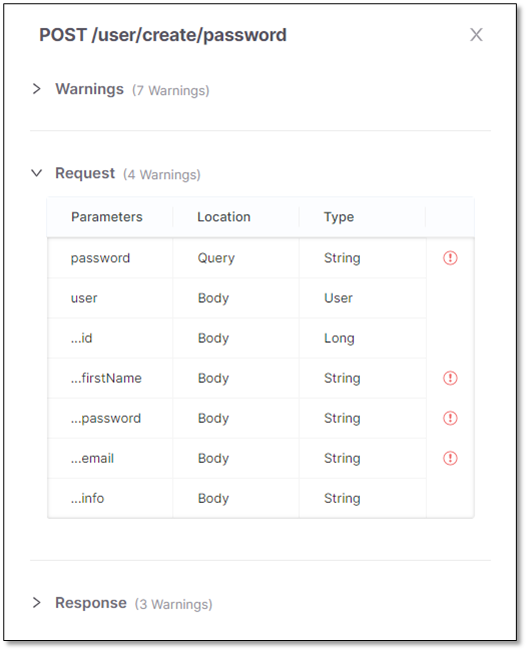
List of all parameters in the request to the API. The sensitive parameters are labeled
 .
.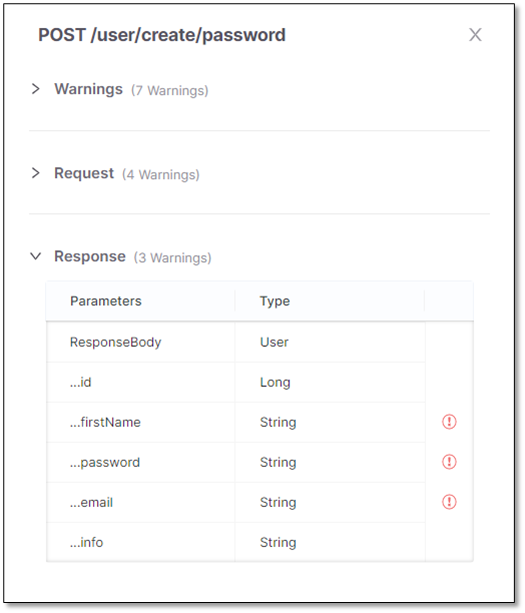
List of all parameters in the response by the API. The sensitive parameters are labeled
 .
.