Scan
The Scan template is a new version of the current report available in CxSAST. It now has an expanded set of data points and a new and "refreshed" template with a user-friendly interface.
The following template types are available:
Vulnerability Type oriented - the displayed results are grouped by the vulnerability type.
Results State oriented - the displayed results are grouped by the resulting state.
Permissions
To be able to generate the Scan report, the user must be associated with an Access Control role with the generate-scan-report permission.
Generic KPIs
The following KPIs are common to both Scan templates:
Scan Information
 |
Scan Information
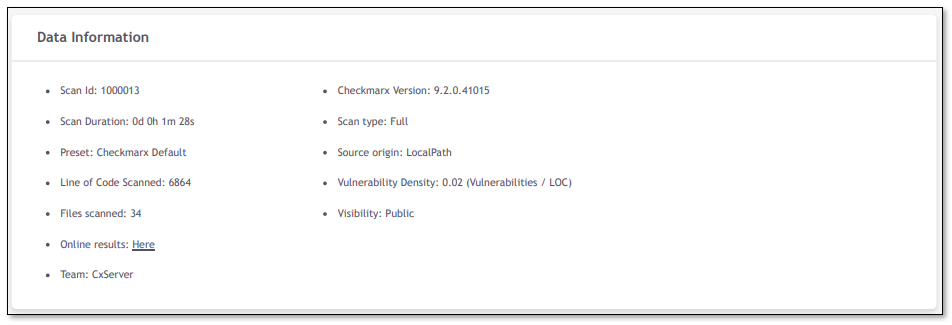
The Scan Information card shows details related to the scanned project, such as Preset and Team, and to the scan itself, such as Scan Duration and Lines of Code Scanned.
Filtered By
In this card you can see the filters applied when generating the report:
 |
Applied Filters
Included: Data included in the report. All data available in the report is filtered according to the specified included filters.
Excluded: Data filtered out from the report.
Specific filters can be applied when generating the scan template to restrict and refine the data and the results to analyze.
The following filters can be defined when generating a scan template:
Severity: By default, Low and Informative results are excluded.
Allowed values that can be excluded from the report are: Critical, High, Medium, Low, and Information.
Result State: By default, all result states are included.
Allowed values that can be excluded are: To Verify, Confirmed, Urgent, Proposed Not Exploitable, and Not Exploitable.
Query/Vulnerability Type: By default, all queries are included. By clicking on the link you are re-directed to the Vulnerability Type section.
Status: By default, only New and Recurrent are included.
Allowed values that can be excluded are: New, Recurrent, and Resolved.
What happens when Resolved results are included?
The Resolved Results section is displayed in the report.
All other KPI calculations (that are not part of the Resolved Results section) are not affected by the resolved results.
What happens when Resolved results are excluded?
The Resolved Results section is not displayed in the report.
Results Limit: When applied it does not impact any KPI calculation, since all results are taken into consideration when calculating the data points. This filter only impacts the number of results displayed and printed in Scan Results section. By default the Results Limit value is set to 5000.
For further details on how to define and apply filters see the APIs page.
Scan Results Overview
Density grade
Density Grade
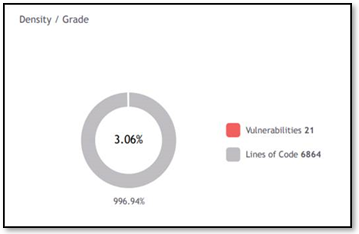
Show the ratio between the total of vulnerabilities and the lines of code. It is calculated based on (Total of vulnerabilities/Total lines of code)*1000.
By Status
 |
By Status
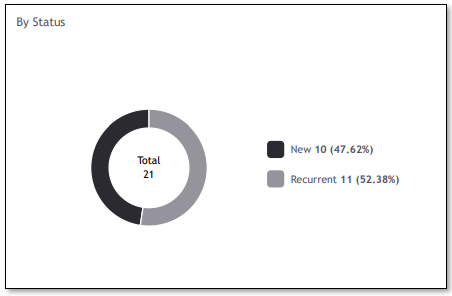
The pie chart shows the number of findings grouped by Status (New vs Recurrent). For each status, the total of number findings and its percentage is displayed.
By Language

By Language
The stacked chart shows the number of findings detected for each scanned language and severity. Trends are also available showing if the number of results in the current scan has decreased or increased when compared to the previous full scan, and how much the variation is. Density and density trends are also displayed.
Top 5 Oldest Vulnerabilities by Severity
Top 5 Oldest Vulnerabilities by Severity
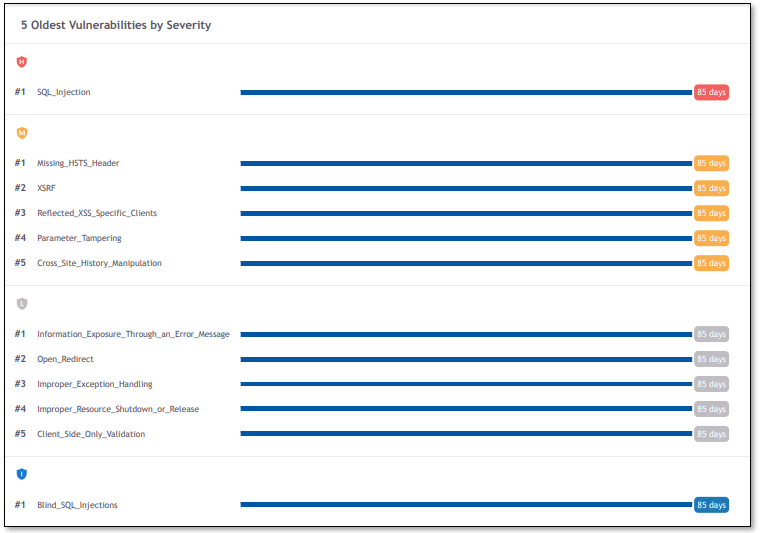
The aging is calculated restricted to the project you are analyzing, meaning that the first detection date for the vulnerability in this project is taken in consideration. The aging refers to the scan date where the vulnerability appeared and not to the project creation date.
Example:
Project A has vulnerability 1 which appeared in June 2021.
Project B has been created in July 2010 and shares the same code as Project A.
The first scan for Project B ran on August 2021 and a Scan Report was generated in September 2021. In the Report, the vulnerability 1 aging is 1 month (calculated based on the first scan).
Vulnerability 1 is resolved and disappears between September and December, then it re-appears in January (for the same source code). If the report is generated in January, the aging is between September and January (4 months). In case it re-appears for different source codes, the aging is calculated according to the difference between the current and first detection dates.
Vulnerability Type Group
Scan Results Overview
By Severity
 |
By Severity KPI
This pie chart shows the scan results grouped by severity. For each severity, the total number of findings, its percentage, and the trend are displayed. The trend tells us if the number of results in the current scan has decreased or increased when compared to the full previous scan, and how much the variation is.
Also, the density and density trends are available in this card.
Vulnerability Type
 |
By Vulnerability Type and Severity
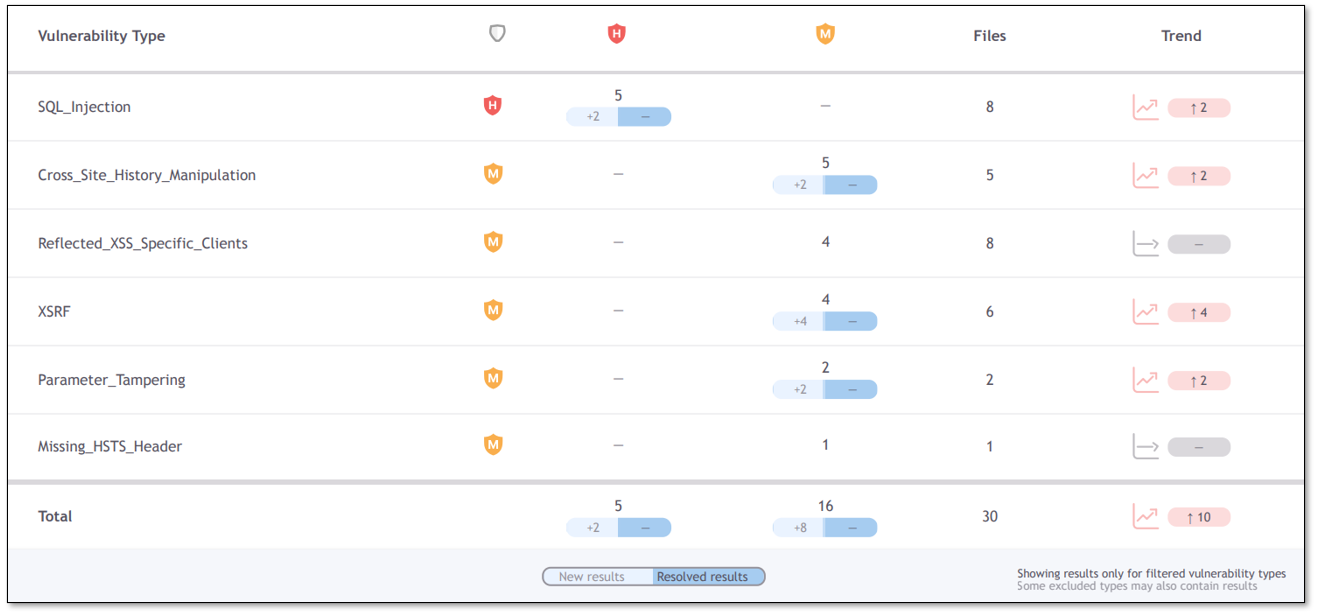
The table shows us the information by each vulnerability type and for each, there is a breakdown by severity.
The second column refers to the vulnerability type severity. In case the severity of a result is changed from the default severity to another one, the total results will be displayed under the specific severity column.
The blue capsule shows how many new vulnerabilities appeared and how many were resolved between the previous full scan and the current one. The overall Trend is the difference between the New Vulnerabilities and the Resolved ones (New – Resolved).
Also the number of files where each vulnerability type was detected is displayed in the column Files.
All the vulnerability Types displayed in the table are according to the defined filters, meaning that excluded vulnerability types won't be displayed even if they have findings.
Top 10 Vulnerabilities
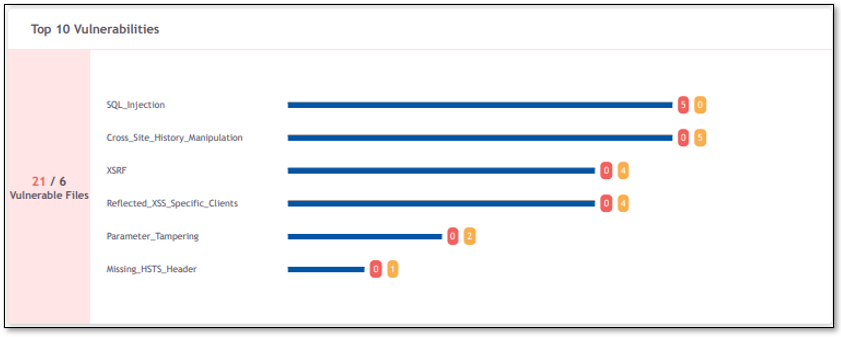
This card displays the 10 vulnerabilities having the higher total of findings in the scan.
 |
Top 10 Vulnerabilities
For each Vulnerability, the total results by severity is displayed.
Taking SQL_Injection as an example, there are 5 High results and 0 Medium.
Top 10 Vulnerable Files
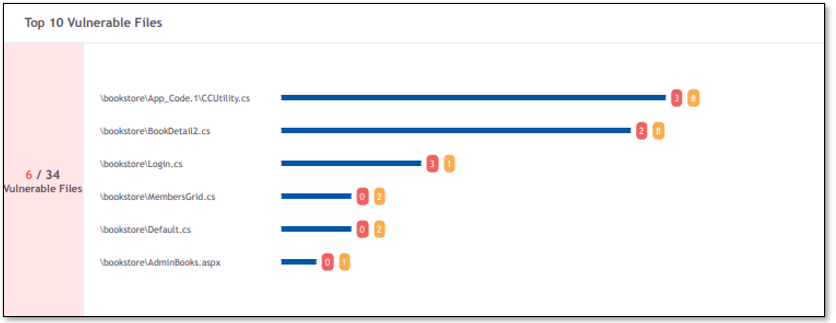
This card displays the 10 files containing the higher total of findings.
 |
Top 10 Vulnerable Files
For each File, the total of results by severity is displayed.
Taking \bookstore\Login.cs as example, the file has 3 High results and 1 Medium.
Scan Results
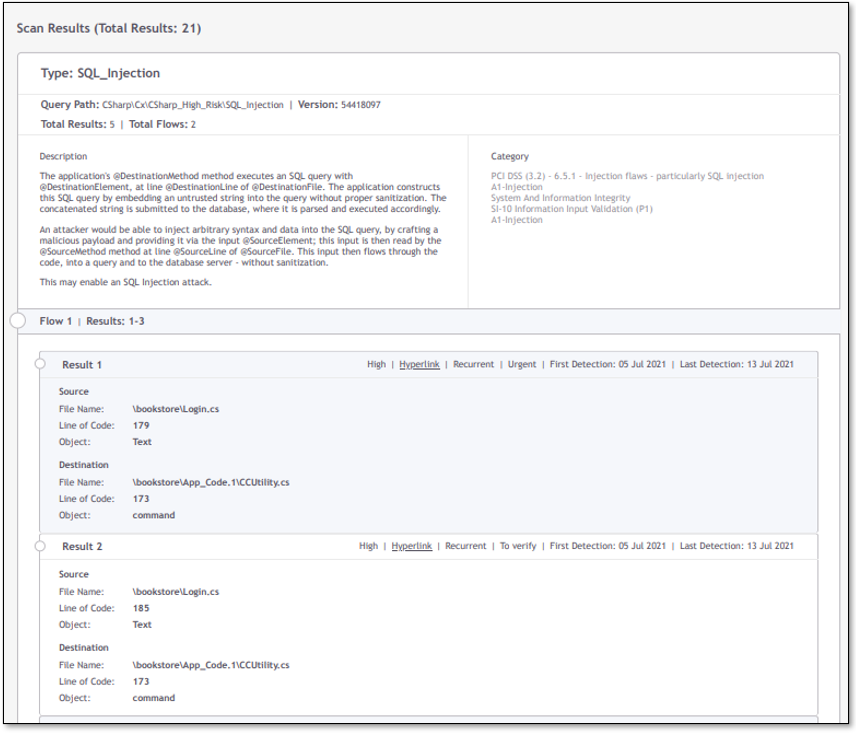
The scan results are presented grouped by Vulnerability Type.
 |
Scan Results grouped by Vulnerability Type
For each Vulnerability Type it is presented the total results and the total flows, along with a Description and the Categories to which the vulnerabilities are related to.
For each Flow, all the results are displayed together, and, for each result, several pieces of information are available, such as Severity, Status, First and Last Detection dates, Source, and Destination. By clicking on the Hyperlink, you are re-directed to the Results Viewer in CxPortal to see the specific result.
The results available in this section are according to the Results Limit defined as filters.
Resolved Vulnerabilities
This section only appears in case Resolved Results is included in the report (defined in the Filters).
 |
Resolved Vulnerabilities
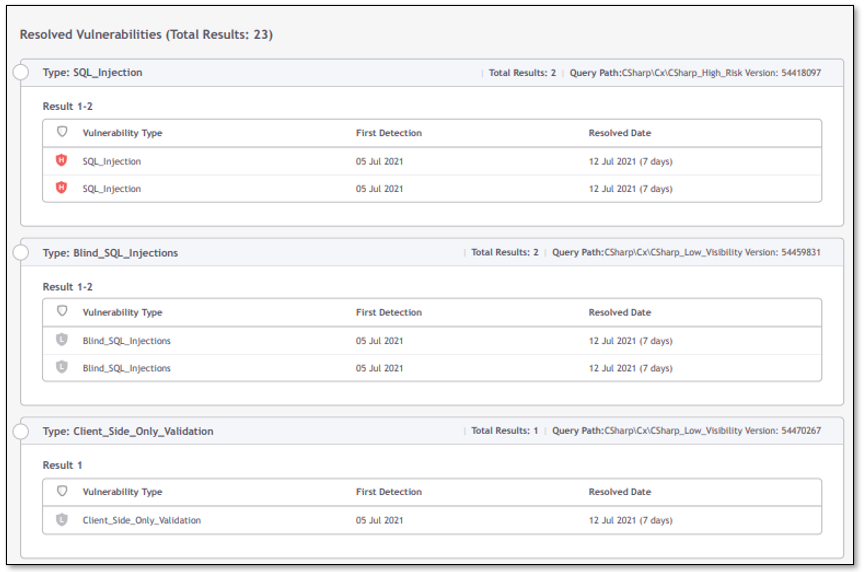
The total vulnerabilities resolved between the previous full scan and the current one (the one in the report) are displayed grouped by Vulnerability Type. For each resolved result, it is displayed the first and the resolved dates, along with the total days it took to be resolved.
Result State Group
Scan Results Overview
By State
 |
By State
This pie chart shows the scan results grouped by the Results State. For each state, it is displayed the total number of findings and its percentage.
Also, the density and density trends are available in this card.
State
 |
By State and Severity
The table shows us the information by each Result State and for each of these, there is a breakdown by severity.
The blue capsule shows how many new vulnerabilities appeared and how many were resolved between the previous full scan and the current one. The overall Trend is the difference between the New Vulnerabilities and the Resolved ones (New – Resolved).
Also, the number of files where each state has results is displayed in the column Files.
Scan Results
The scan results are presented grouped by Result State.
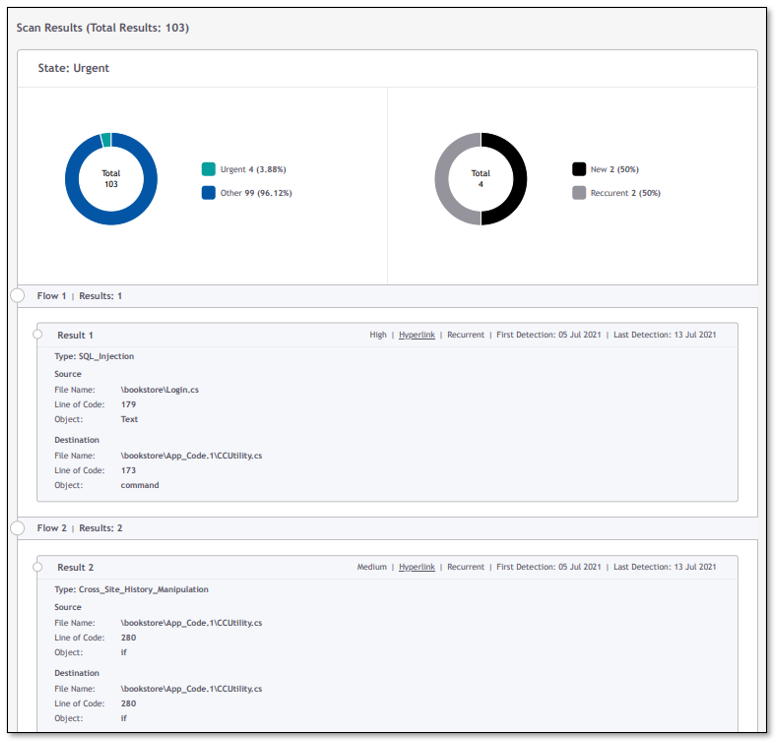 |
Scan Results grouped by Result State
For each group (Urgent, in the image above) it is presented the total results and the percentage for the specific Result State and the remaining total as well (which corresponds to all the other Result States). Also, the New vs Recurrent results are displayed for the specific Result State.
For each result, there is a lot of information available, such as Severity, Status, First and Last Detection dates, Source, and Destination. By clicking on the hyperlink, you are re-directed to the Results Viewer in CxPortal to see the specific result.
The results available in this section are according to the Results Limit defined as filters.
Example:
Scan has 1500 results and Results Limits is set to 150.
In this section, it will appear Total Results: 1500, however only 150 results will be printed.
Resolved Vulnerabilities
This section only appears in case Resolved Results are included in the report (defined in the Filters).
 |
Resolved Vulnerabilities
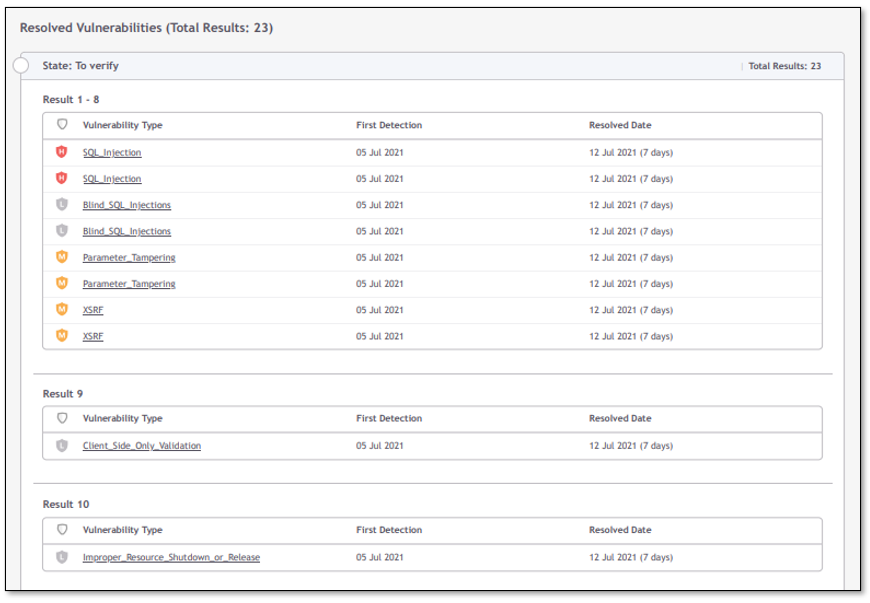
The total vulnerabilities resolved between the previous full scan and the current one (the one in the report) are displayed.
For each vulnerability, there is a link that re-directs you to the specific result in the Results Viewer in Checkmarx Portal.
Categories
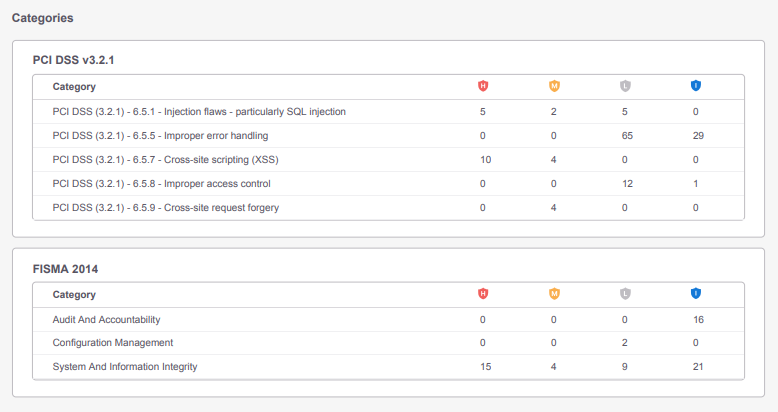
This section is viewable only if the metadata for Categories was enabled when generating the report.
The total results are organized by severity for each of the categories defined in the metadata.
Categories with 0 results are displayed only if the option Exclude zero results is not selected in the metadata.
 |