Scans
The Scans page displays the scan history of Projects and Applications for the Checkmarx One tenant. A Group or Team Lead can obtain an overview of the risk to a project or feature in its entirety.
To view the Scans history, in the main menu, click on Resource Management  > Scans.
The following table describes the information shown for each scan.
Column | Description |
|---|---|
ID | The system generated, unique identity, of the project or feature scanned. |
Scan Date | The |
Project | The name of the project or feature that was scanned. |
Branch | The branch that was scanned for a specific project. |
Tags | The tags specific to Scan Management. Providing these distinguishing tags is useful for filtering information. A specific scan can be tagged, which ensures that it is easily found when filtered. |
Scan Origin | The scanned project location. |
Source | This parameter indicates how the project is uploaded onto the system to be scanned. It can be a repository, such as GitHub, or a zipped file. |
Initiator | The username of the individual who invoked the scan. |
Scan Type | There are two types of scans, Full Scan and Incremental Scan.
|
LOC (Lines of Code) | Presents the number of lines of code that were included in the last scan. This feature is essential for users seeking a comprehensive view of their scans, enabling them to promptly spot gaps or missing data, ensuring a thorough analysis. CxOne Scan History LOC total is a summary of both SAST & IaCS scans. |
Status | The scan status. For example, Active when a scan is running, Failed if an error occurs and the scan cannot continue, Completed if the scan is successful and Queued if the scan is waiting to be run. |
Filtering and Sorting the Scans Table
The scans table can be filtered and sorted to display the relevant scans for your view in the correct order. By default, the scans table is sorted in descending order by the date of the scan.
Quick Filtering
You can quickly filter the scans in the table to display only the selected scan status by clicking on the corresponding box at the top of the page or by performing a search.
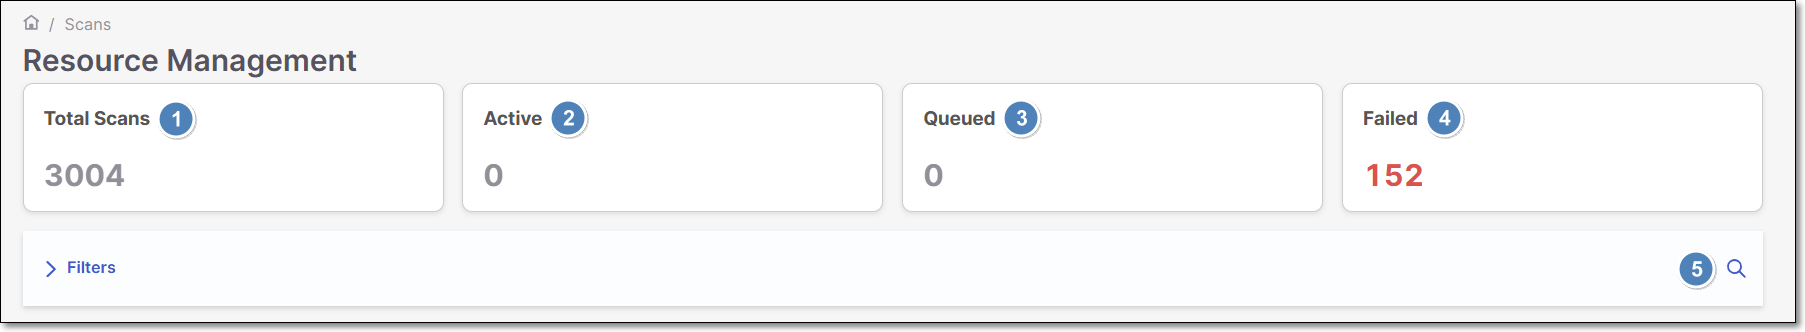 |
Total Scans - The default view that displays all of the scans in the system.
Active - Displays the scans that are currently running.
Queued - The scans that are waiting to run, once previously executed scans are complete.
Failed - The scans that have failed and stopped running.
Search - Enter a search value. The table will be populated only by scans that match the search value.
Filters Bar
The Filters bar is used to view and manage all of the filters applied to the table. When filters are applied, a description is shown on the bar indicating the number of filters applied.
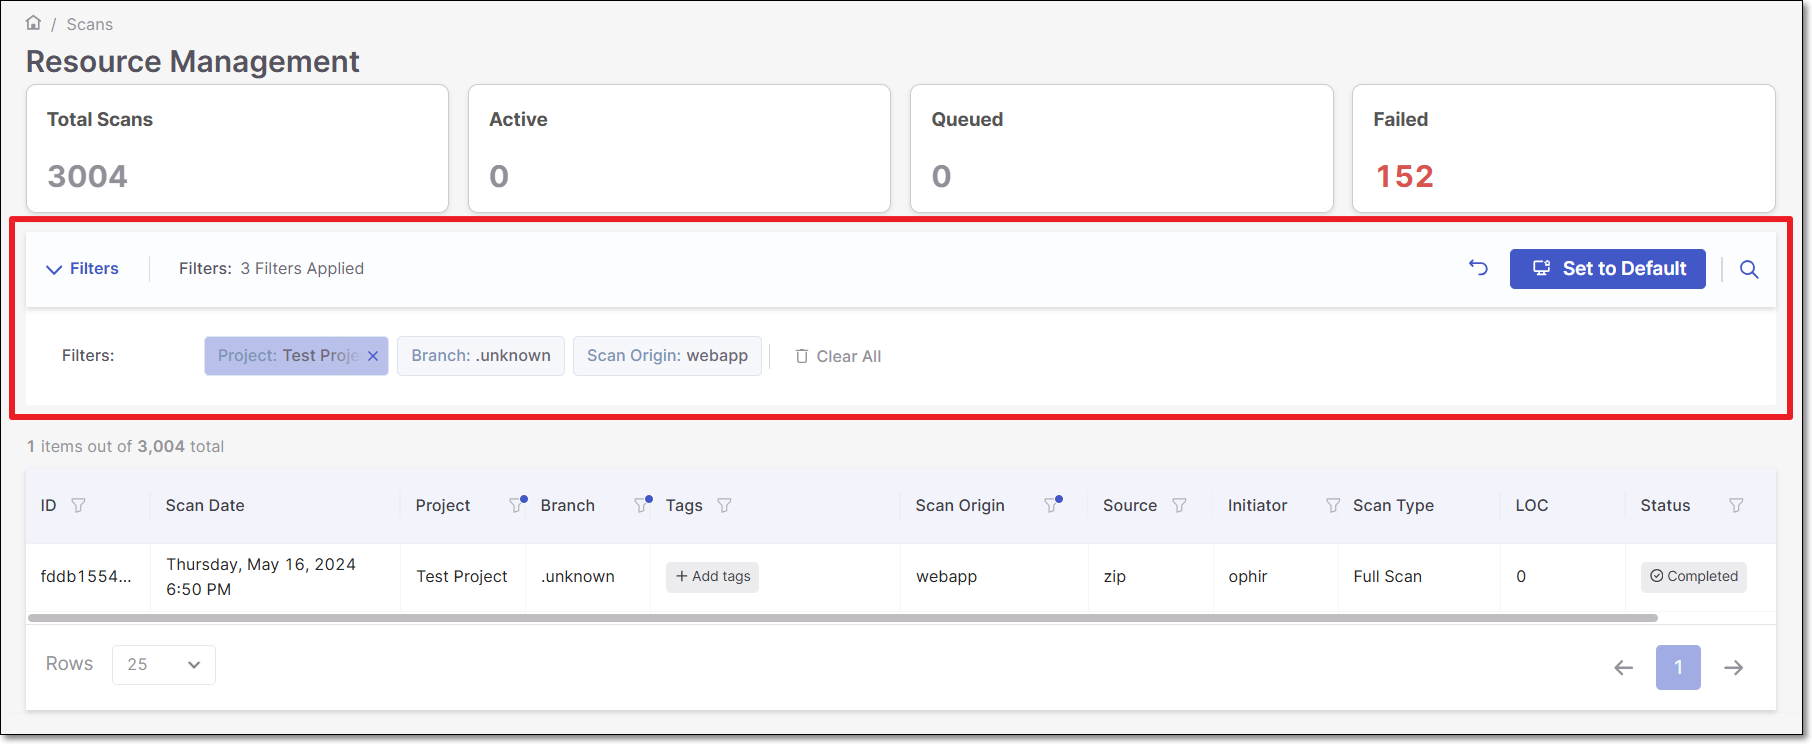 |
To manage the Filters bar:
Click on the Filters bar to expand and show the applied filters.
If you would like to remove one of the applied filters, hover over the filter and click the X, or click on Clear All to remove all of the applied filters.
Click on the Set to Default button if you would like to set the applied filters as the default.
Click on the Revert icon to return to the default view.
Filtering the Table
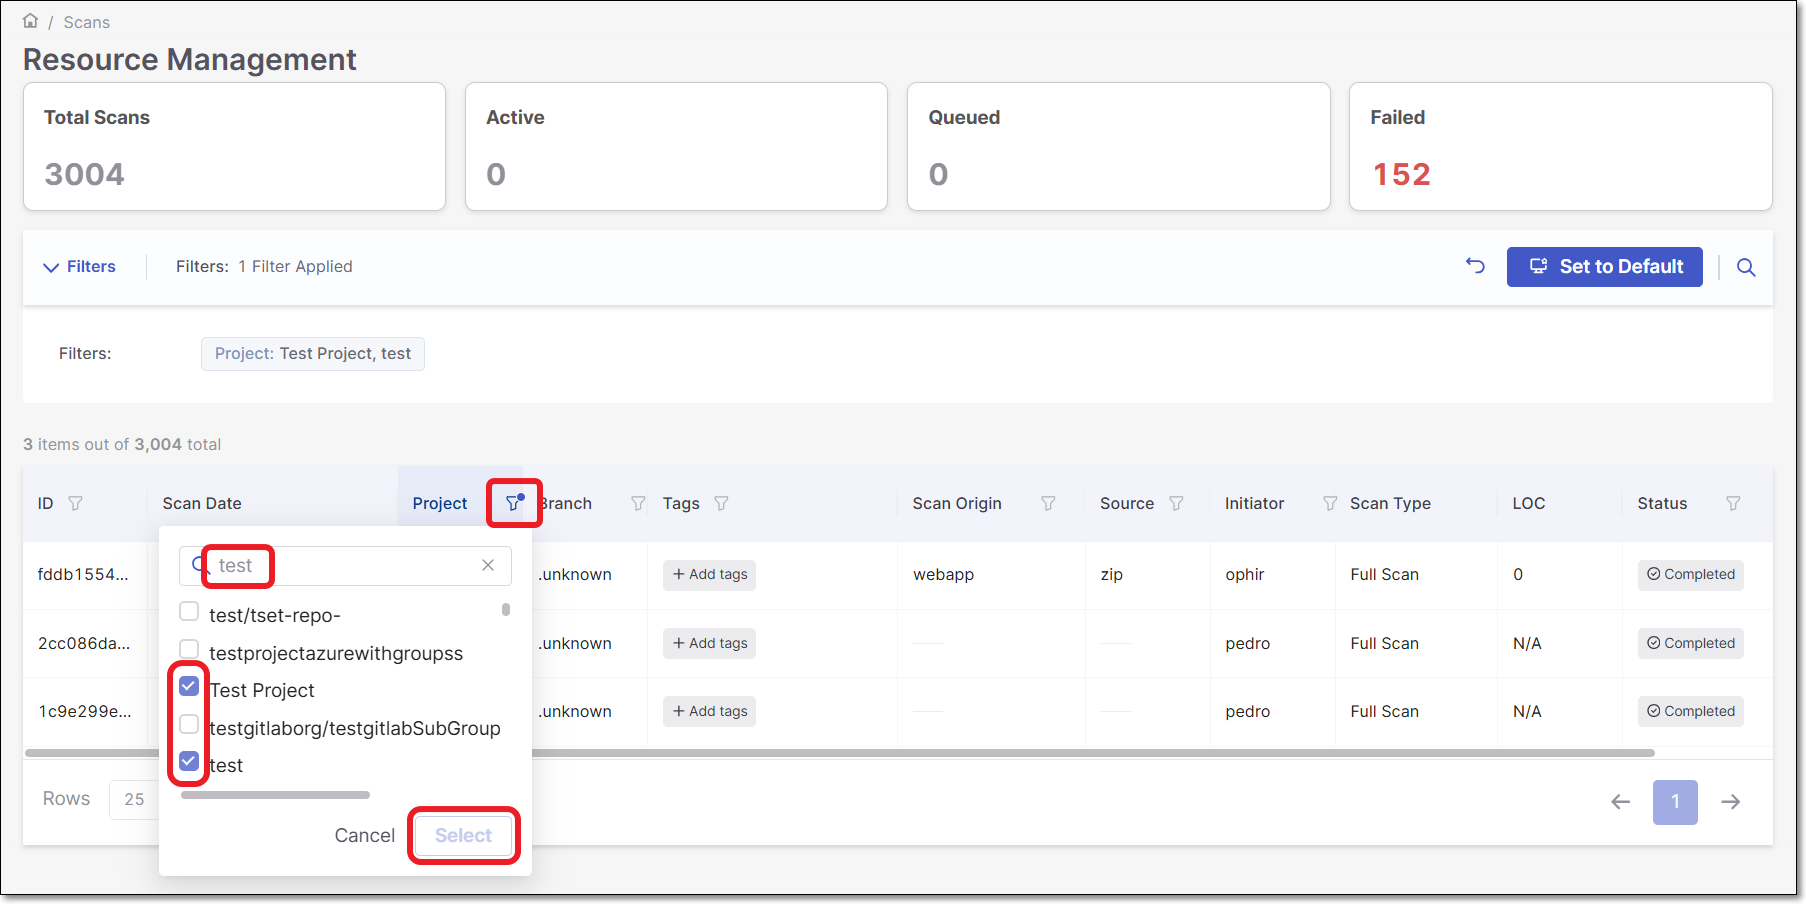
To filter the table:
Click on the filter icon on the column header desired for filtering.
A dropdown list appears.
Select one or more checkboxes for the relevant filter. You can use the search box to search for a specific filter.
Click Select.
The filters are applied to the table, and a blue dot indicator is added to the filter icon in the column header.
The following columns support filtering:
ID
Project
Branch
Tags
Scan Origin
Source
Initiator
Status
Sorting the Table
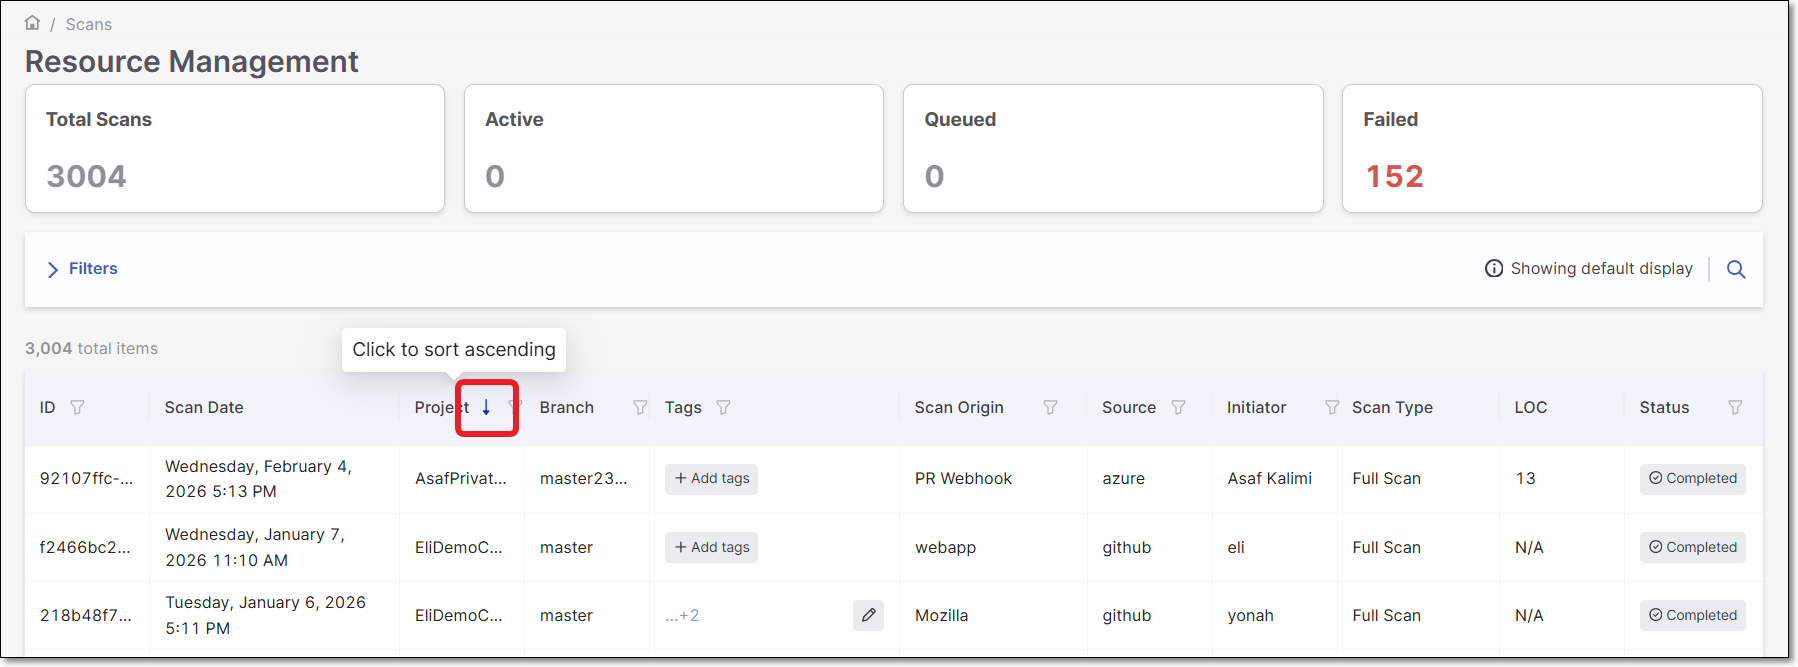
To sort the table:
Hover over the column header desired for sorting.
The sorting arrow is displayed.
Hovering over the arrow will display a tooltip describing the order (Ascending / Descending) that the table will be sorted.
Click on the Arrow to apply the sorting.
The sorting is applied, and the column header displays the arrow pointing in the direction of the sorting (Up = Ascending, Down = Descending).
The following columns support sorting:
Scan Date
Project
Branch
Scan Origin
Initiator
Status
Pagination
The Rows field indicates the number of scans that are displayed on the page. The default is 25.
To select the number of scans displayed on the page:
Click on the Rows field.
A dropdown with row selections appears. Available options: 10, 25 (default), 50, 100, 200.
Select the number of scans to view per page.
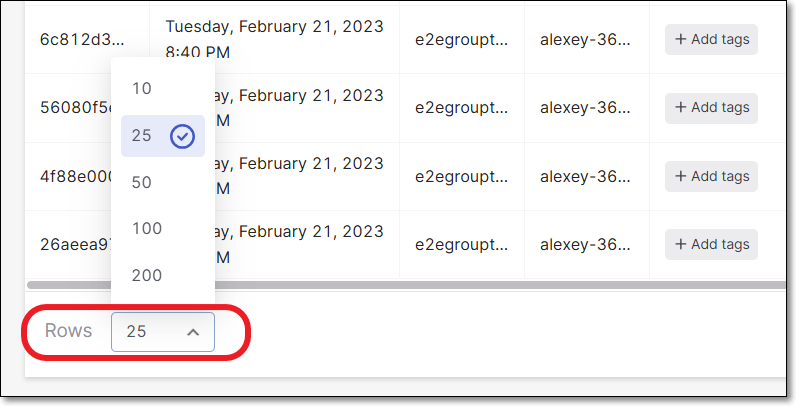
The number of scans displayed on the page will change according to the selection made.