- Checkmarx Documentation
- SAST/SCA Integrations
- IDE Plugins
- Visual Studio Plugin
- Reviewing Scan Results in Visual Studio
- Understanding Visual Studio Scan Results
Understanding Visual Studio Scan Results
When viewing scan results in Visual Studio, in the CxViewer Tree (at bottom-left), double-click a detected vulnerability type to display an interactive interface for navigating the results:

Source code panes may be collapsed (at the top); you can expand them.
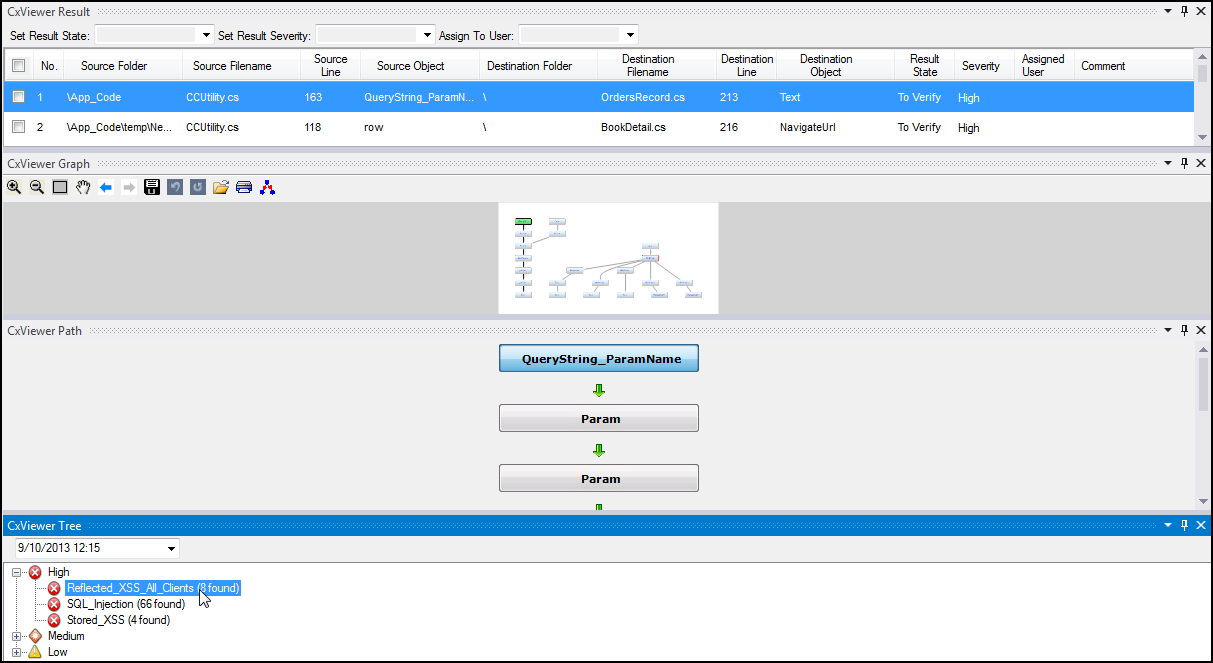
The CxViewer interface includes four panes with different levels of information:
CxViewer Tree (bottom): Lists all vulnerability types in a navigation tree according to Severity (Critical, High, Medium, Low, Information). Click a vulnerability type to display its instances in the panes above.
Right-click the vulnerability and select Show Description. Once the description opens, you can review the vulnerability risk, cause, and remediation information.
Note
You may be asked to log in to view the Show Description panel. After logging in, the login screen will not be displayed when selecting subsequent items in the CxViewer tree.
Click the Codebashing icon
 to redirect to our interactive learning platform, where you can learn about code vulnerabilities, why they happen, and how to eliminate them. Once there, select a tutorial and start sharpening your skills.
CxSAST users have free access to a limited set of Codebashing lessons.
Available free lessons are:
SQL Injection (SQLi)
Cross-site scripting (XSS)
XML Injection (XXE)
The free lessons are available for the following programming languages:
Java
.Net
PHP
Node.JS
Ruby
Python
The full (paid) version includes more than 150 individual lessons across many common web, mobile, and embedded programming languages. For a full list of supported programming languages and lessons and additional information, refer to Codebashing.
CxViewer Result (top): Tabular detailed list of all found instances of the vulnerability type selected in the CxViewer Tree. Select an instance to emphasize it in the graphical panes (Graph and Path; see below). Specifying comments while changing the result state can be mandatory based on the configuration in SAST.
CxViewer Graph (below CxViewer Result): Graphical display of full paths of all found instances of the vulnerability type selected in the CxViewer Tree.
Graphical intersections represent the relationships between the instances, and the instance that is selected in the CxViewer Result pane is emphasized in the Graph (bold arrows), and one of its elements is highlighted (green).
The red-bordered element represents a best-fixed location: securing the code at this point will fix multiple instances of the vulnerability.
You can navigate the Graphs with the provided MSAGL controls.
Select an element to view and select this code in the context of the file's source code above (you may need to expand the source code pane). This also causes the instance to be displayed in the Path pane.
CxViewer Path (below CxViewer Graph): The full path of code elements that constitute the vulnerability instance selected in the Graph. This path represents the full attack vector for the vulnerability instance.
Select a code element in the Path to view, select it in the file's source code, and highlight it in the graph.
Notice
If source code files are available in the file system but not part of the solution file, they are scanned, but the browser results return an error indicating that the source file has not been found.