- Checkmarx Documentation
- SAST/SCA Integrations
- IDE Plugins
- IntelliJ Plugin
- Understanding IntelliJ Scan Results
Understanding IntelliJ Scan Results
When viewing full scan results in the IntelliJ CxViewer interface, you can interactively navigate through the results:
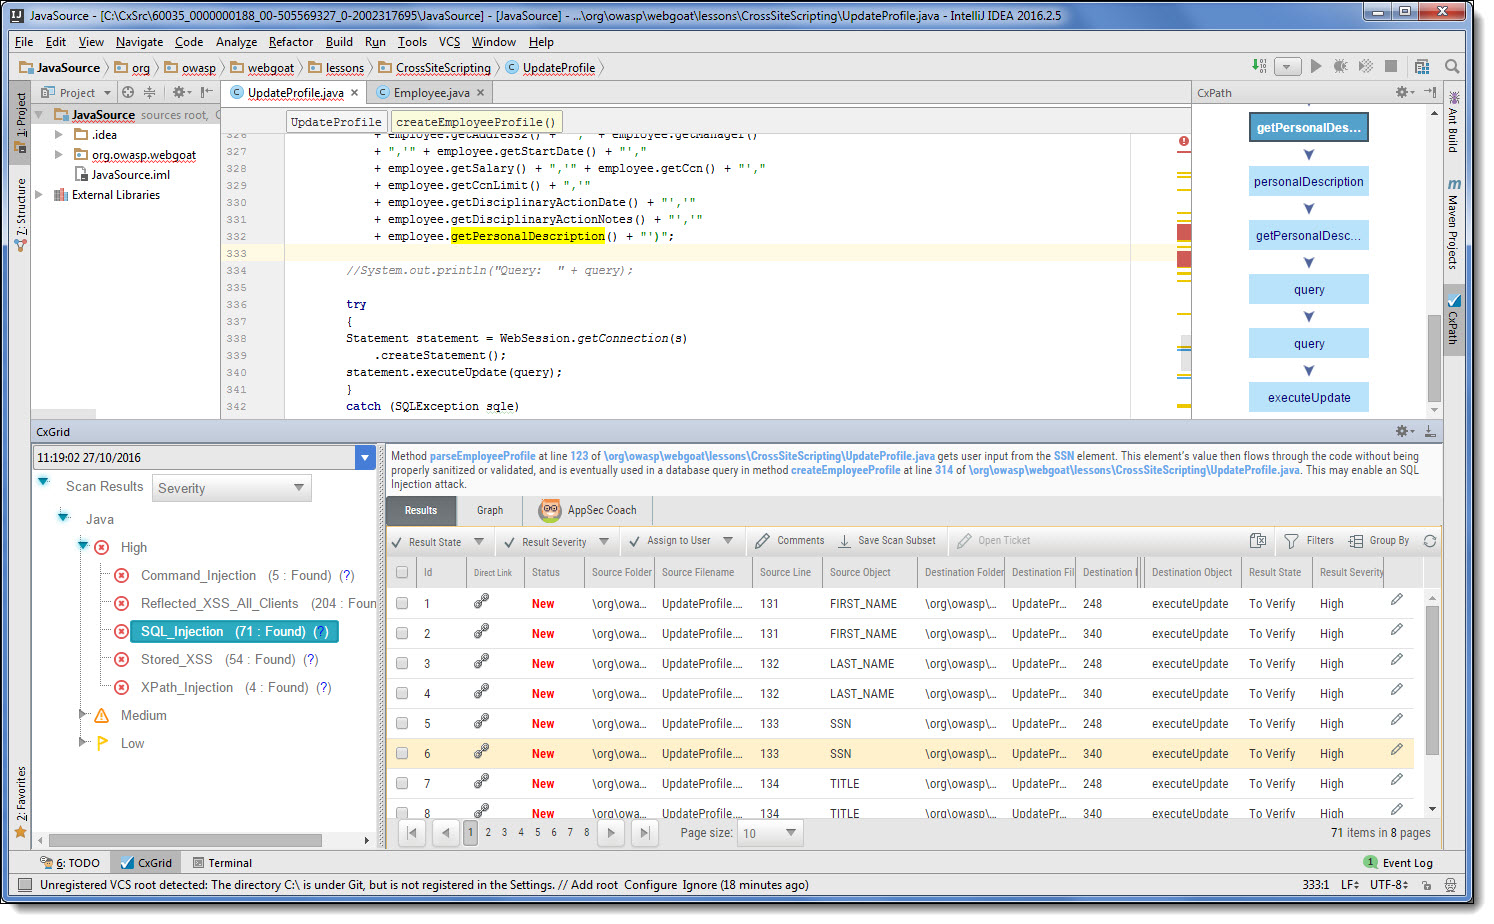
In addition to the regular IntelliJ code pane (upper-left pane), the CxViewer interface includes four panes with different levels of information. You can drill down from a comprehensive list all the way down to the actual code elements, by moving through the panes in the following order:
Queries (lower-left pane) - Each item in the list is a specific type of vulnerability for which CxSAST queries the scanned code, with the number of found instances of that vulnerability. The queries are sorted by code language and severity.
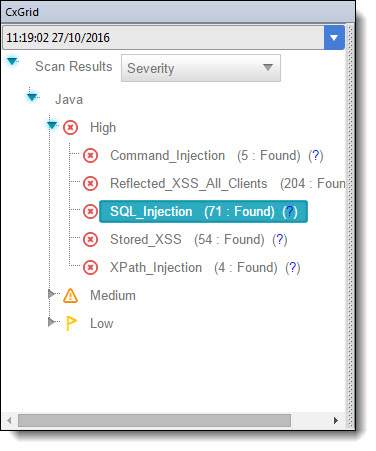
Clicking (  ) takes you to the Codebashing, our interactive learning platform, where you can learn about code vulnerabilities, why they happen, and how to eliminate them. Once there, select a tutorial and start sharpening your skills.
Codebashing™
CxSAST users can have free access to a limited set of Codebashing lessons.
Available free lessons are: SQL Injection (SQLi), Cross-site scripting (XSS), XML Injection (XXE). The free lessons are available for the following programming languages: Java, .Net, PHP, Node.JS, Ruby, Python.
The full (paid) version will include over 150+ individual lessons across many common web, mobile and embedded programming languages. Please refer to Codebashing for a full list of supported programming languages and lessons.
Clicking ( ? ) displays comprehensive information about this vulnerability type, including risk details, a description of the cause and mechanism, recommendations for avoiding the vulnerability and source code examples.
Select a query to view found instances in the Results pane:
Results (lower-right pane) - Displays the found instances of the query that is selected in the Queries pane in the following two formats:
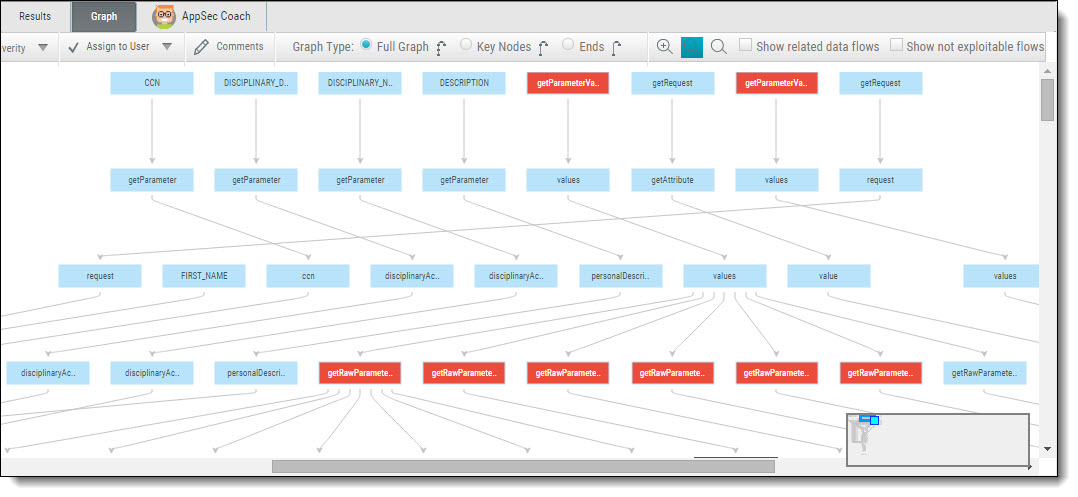
Graph (left tab in Results pane) - Graphical display of first and last code elements of each found instance, with the relationships between them.
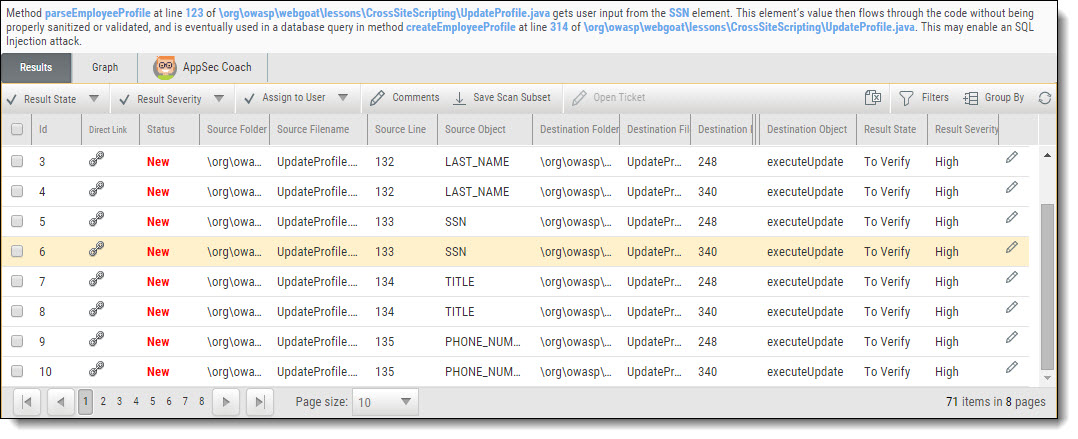
Results (right tab in Results pane) - Tabular list of found instances and details. The highlighted instance's code element details appear at the top. You can navigate the results using pagination control.
Select an instance node (Graph tab) or an instance check-box (Results tab) enabling you to change the following states:
Caution
After the Windows Defender update 1.421.1630.0., the verification time for Chromium binaries has increased. There are two ways to address this situation quickly:
Add the directory with Chromium binaries to the whitelist.
Rollback the Windows Defender update.
Our recommendation is to add the binaries directory to the whitelist by doing the following:
Chromium binaries will be available in the User’s temp directory on Linux and macOS and the AppDataLocalJxBrowser directory on Windows. Navigate to Start → Settings → Update & Security → Windows Security → Virus & threat protection.
Under Virus & threat protection settings, select Manage settings.
Under Exclusions, select Add or remove exclusions.
Select Add an exclusion, then select the Chromium binaries directory.
Results State - useful for disregarding false positives or just for planning what issues to handle
To Verify (default) – instance requires verification (i.e., authorized user)
Not Exploitable – instance has been confirmed as not exploitable (i.e., false positive). Instances defined with this state are not represented in the scan summary, graph, reports or dashboard, etc.
Proposed Not Exploitable – instance has been proposed as not exploitable (i.e., potential false positive). Instances defined with this state are represented in the scan summary, graph, reports or dashboard, etc. until such a time that the state is changed to “Not Exploitable"
Confirmed – instance has been confirmed as exploitable and requires handling
Urgent – instance has been confirmed as exploitable and requires urgent handling
Severity (High, Medium, Low and Info) - useful for defining the priority level of the selected issue.
Assign to User - useful for planning who should handle the selected issue.
Click Comments to add a comment to an instance. This metadata is maintained for the project when performing future scans and for instances that continue to be found.
Click Save Scan Subset for selected instances to appear in the results list as an independent result set.
Click  to obtain a URL to this results interface with the instance immediately selected.
Path (upper-right pane) - Displays the full path of code elements that constitute the vulnerability instance that is selected in the Results pane. This path represents the full attack vector for the vulnerability instance.
Select an instance in the Results pane (Results or Graph tab) and view its attack vector in the Path pane.
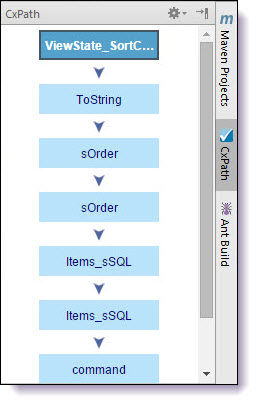
Select a code element in the Path pane to view it in its code context, in the Source Code pane (see below).
Source Code (upper-left pane) - Displays the source code files.
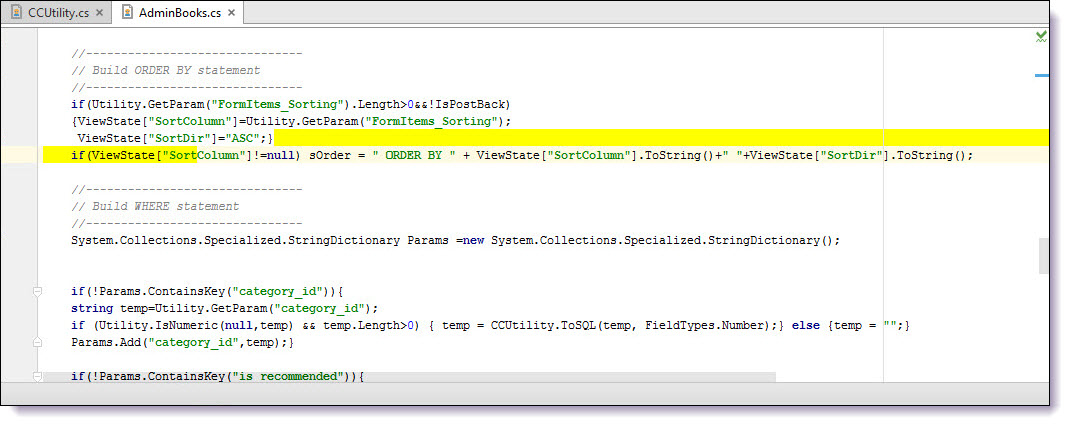
Highlights the code line containing the element that is selected in the Path pane.