- Checkmarx Documentation
- Checkmarx One
- Checkmarx One User Guide
- Managing Projects
- Viewing Projects
- Viewing the Project Details Page
Viewing the Project Details Page
Opening the Project Overview
Go to the Workspace  > Projects page. Hover over the row of the relevant Project and click on the Overview icon.

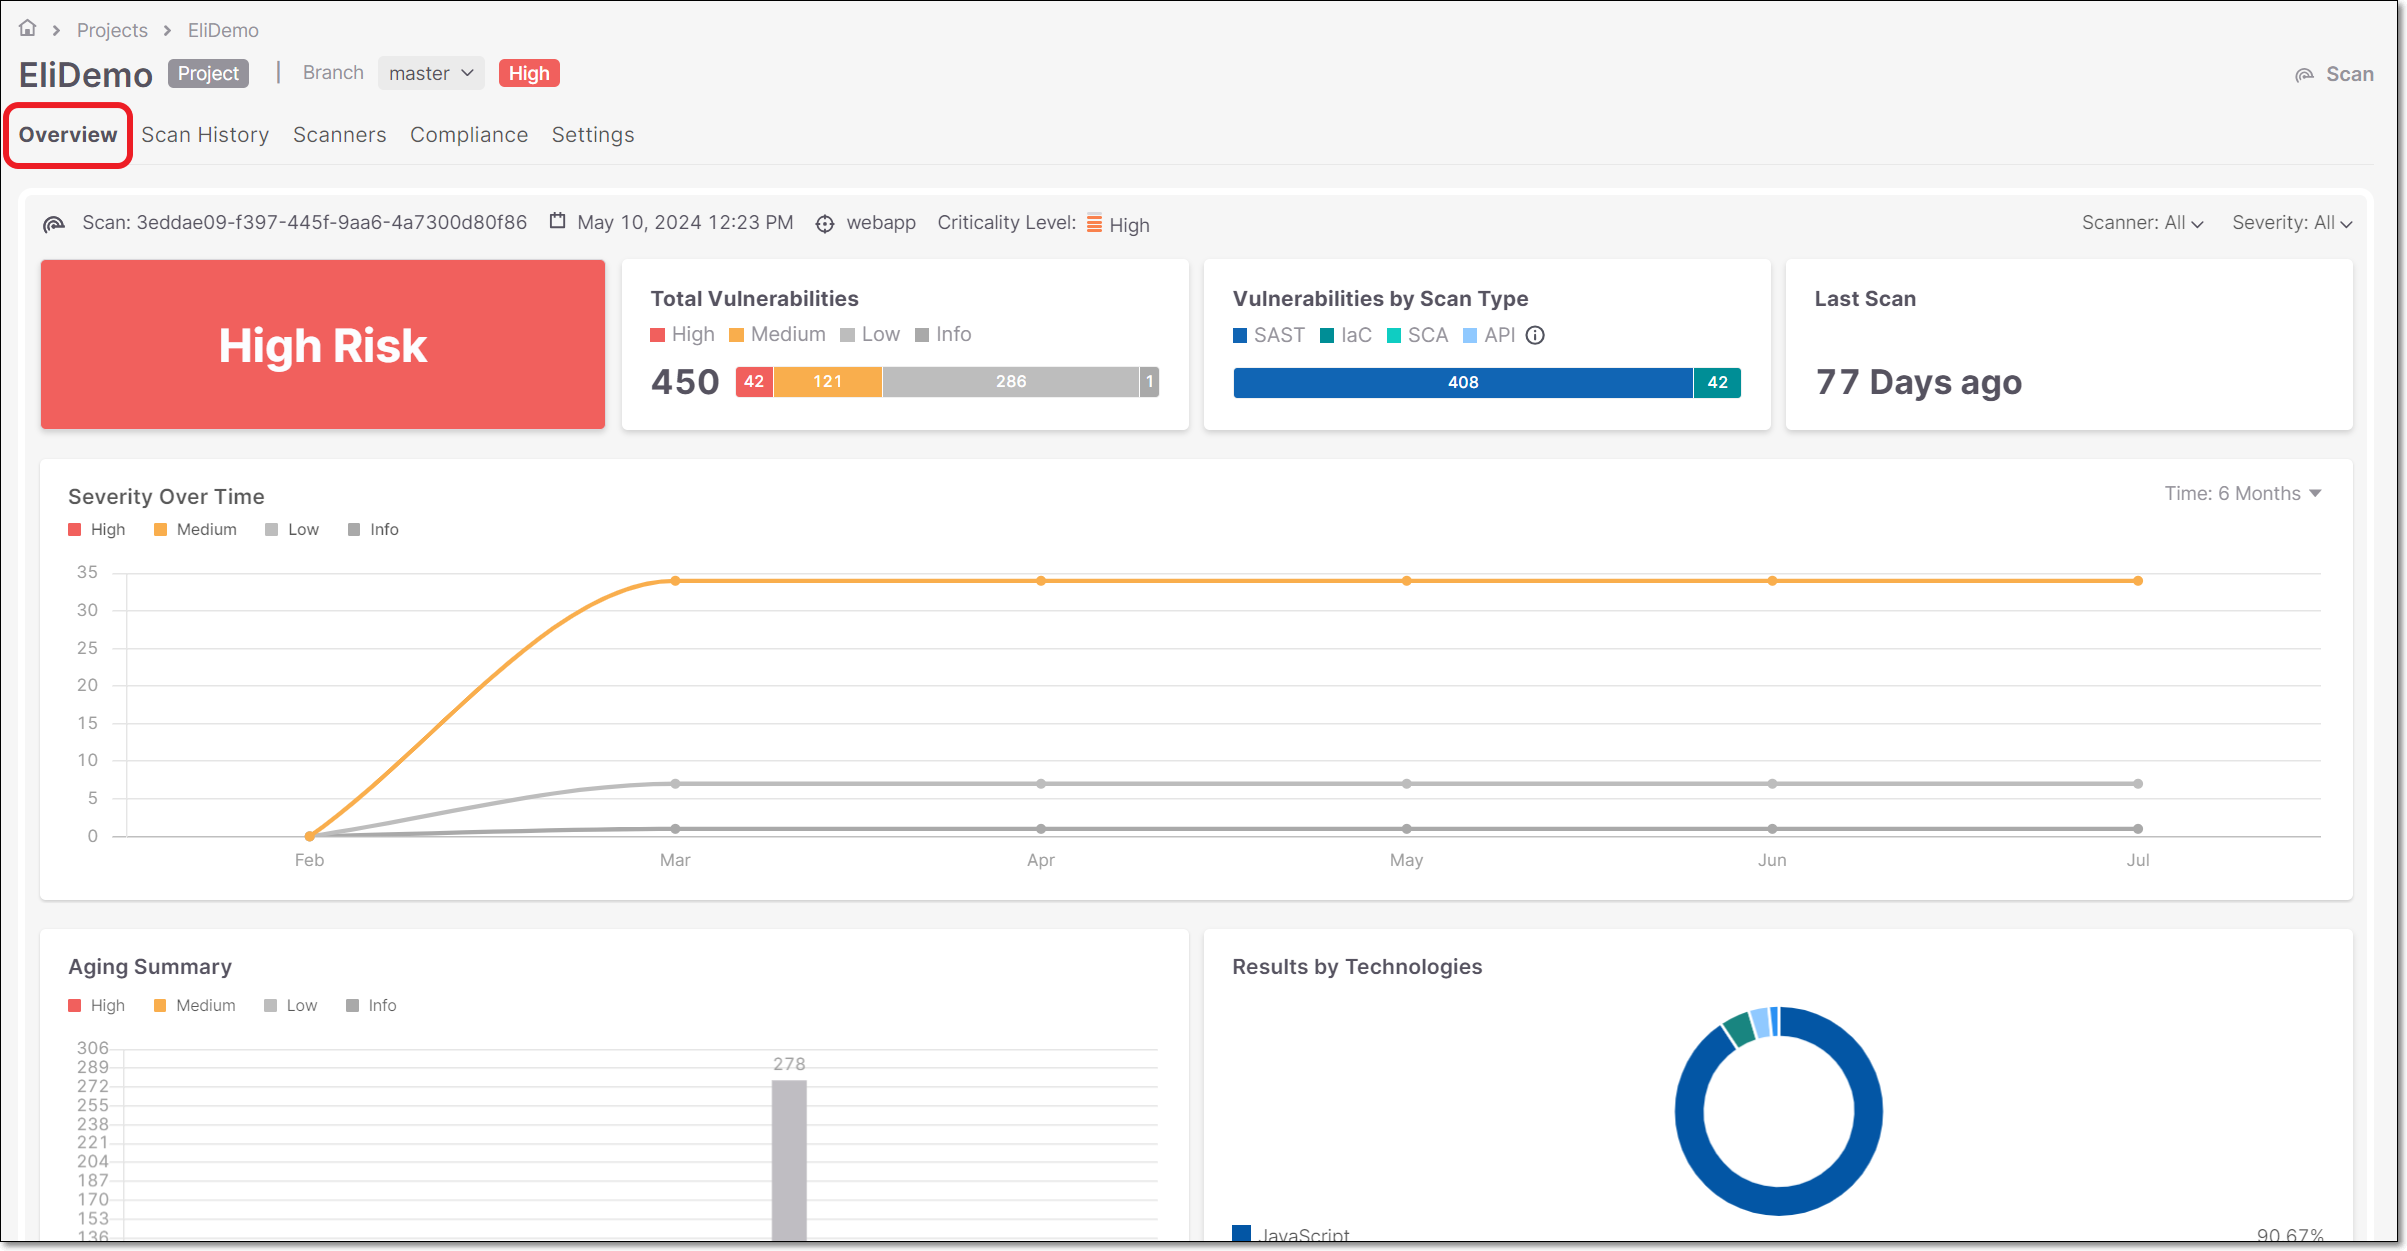
The Project page opens showing the Overview tab.
 |
Header Bar
 |
The header bar provides general project information and contains two action buttons. Throughout the Project Page, this top section remains static regardless of the active tab.
Item | Description | Example |
|---|---|---|
Project Name | Name of the project currently on display | EliDemo |
Branch Filter | Select the branch whose results you wish to view by clicking the dropdown menu next to Branch and choosing the desired option. NoteIf no branch is selected, the results shown will reflect the most recent scan. | Master |
Risk Level | Displays the project risk level |
|
Generate Report | Click to generate a project report for the latest scan | |
Scan | Click to run a new scan |
Project Overview
Project Overview page presents aggregated information and analytics for a specific Project. This tab opens by default when you open the project page.
Overview Widgets
Risk Level
The Risk Level widget displays the project risk level.
The data reflects the last scan in the project for the selected branch.
The widget shows as a colored area that depends on the risk level. It includes a text definition as well:
Critical
High
Medium
Low
Info
 |
Total Vulnerabilities
The Total Vulnerabilities widget displays the number of total vulnerabilities, distributed by severity.
The summary includes vulnerabilities from the last scan of each engine in the project for the selected branch.
The widget includes the following indicators:
 |
The total number of vulnerabilities identified (for all scanners) in the last scan of the project.
Stacked bars (Critical, High, Medium, Low, Info) with the number of vulnerabilities per severity.
Vulnerabilities by Scan Type
The Vulnerabilities by Scan Type widget displays the distribution of vulnerabilities by scan types.
The widget includes the following:
A number of stacked bars - Reflecting the scan types usage, as follows:
SAST - Static Application Security Testing
IaC - IaC Security
SCA - Software Composition Analysis
API - API Security
CON - Container Security
SCS - Software Supply Chain Security
The number of vulnerabilities per scan type.
 |
Last Scan
The Last Scan widget displays the number of days that have passed since the last completed scan to the current date.
 |
Severity Over Time
The Severity Over Time widget displays the latest vulnerabilities value distributed by severity (Critical, High, Medium, Low, Info).
The widget includes the following time ranges:
Week
Month
Three Months
6 Months (Default)
Year
Notice
When Week is selected, data points are shown for each day. When Month is selected, data points are shown for each week. For all other options, data points are shown on a monthly basis.
 |
Aging Summary
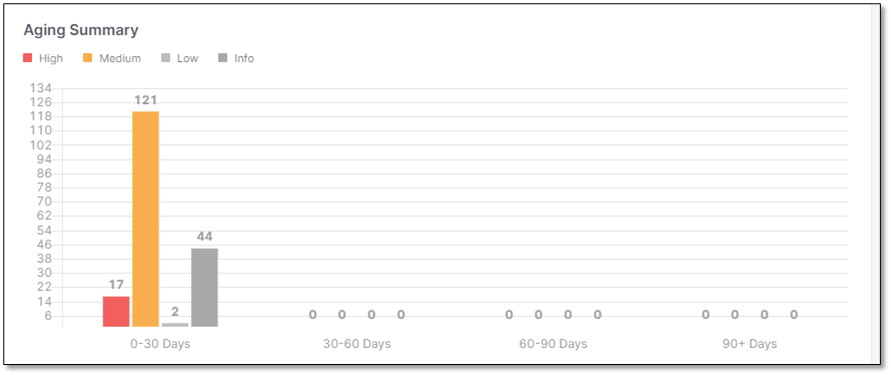
The Aging Summary widget displays the number of vulnerabilities distributed by severities for the first discovery date in a specific time range.
The widget includes a bar chart presentation with the following parameters:
x-axis - Displays 4 constant time ranges:
0 - 30 days
30 - 60 days
60 - 90 days
90+ days
y-axis - Displays the number of vulnerabilities.
Chart data - Stacked bars per each time range (Critical, High, Medium, Low, Info) with the number of vulnerabilities per bar type.
 |
Results by Technologies
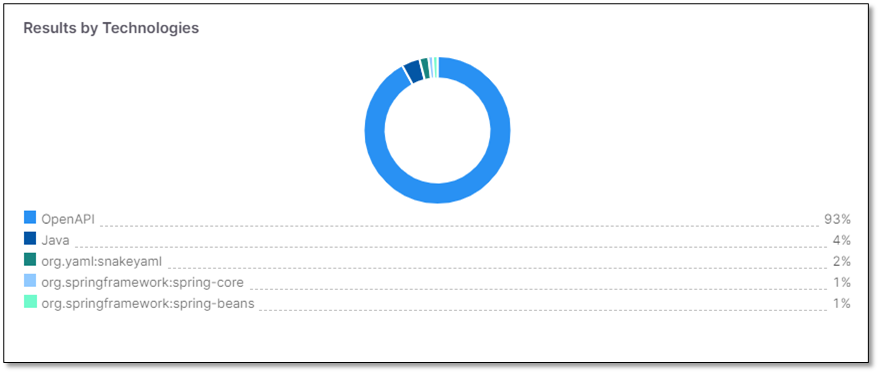
The Results by Technologies widget displays the percentage of vulnerabilities detected for each language and technology.
 |
Compliance
The Compliance widget displays all the compliance standards that exist in the Checkmarx One Database.
Caution
By default, results are shown for all supported compliance standards. It is possible to configure your account to show results only for specific compliance standards that are relevant for your organization. This can be set via the Scan Configuration API.
The data indicates which scan has been verified for the compliance standards and which scan did not.
The widget includes the following:
A donut chart that includes Passed / Failed compliance standards.
A count of:
Passed compliance standards.
Total compliance standards.
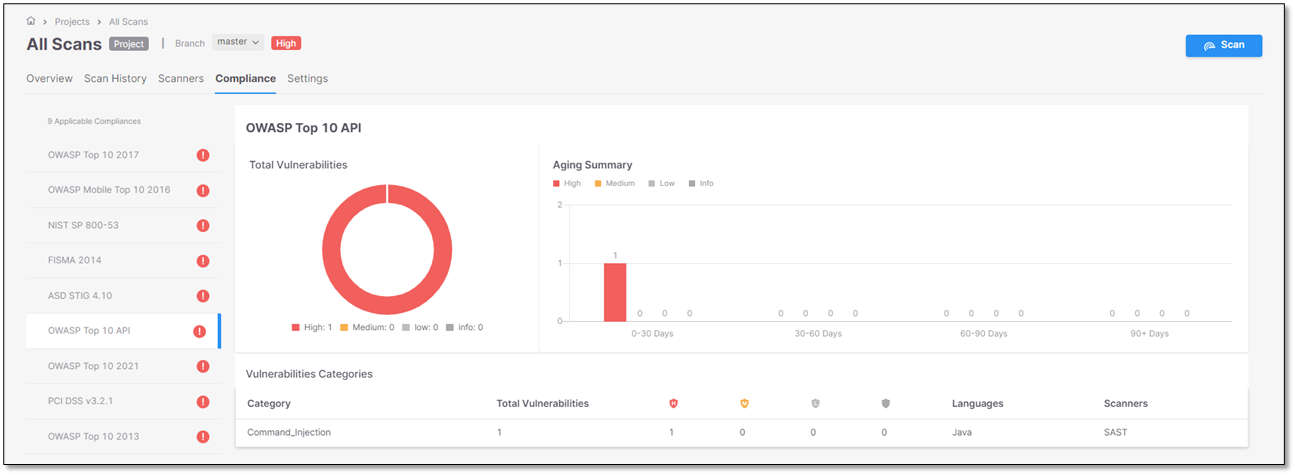
Clicking each item directs the user to the relevant standard in the Compliance tab as illustrated for OWASP Top 10 API as an example.
 |
 |
Scan History
 |
The Scan History tab presents a list of all the scans that were performed within a project.
Each record shows information about each scan that was completed. The screen images illustrate a scenario where all four scanners were used for the scan.
The information appears in a table with each column indicating a different value. These values are listed and explained in the table below.
Column | Description | Possible Values |
|---|---|---|
Scan Date | The date and time on which the scan was performed |
|
Branch | The branch that has been scanned For .zip files, the the value is N/A. |
|
Tags | Project tags |
|
Initiator | The client who initiated the scan |
|
Scan Origin | Shows how the most recent scan of the Project was triggered. |
|
Source | Shows how the source code was accessed for the most recent scan. |
|
Scanners | The scanners that have been used for the scan |
|
Severity | The amount of vulnerabilities, distributed by severities |
|
Scan Type | Scan Type |
|
Duration | Scan duration |
|
LOC (Lines of Code) | Lines of code count in the scan | |
Status | Scan status |
|
Actions | Actions that can be performed on the scan. |
|
Opening Scan Results
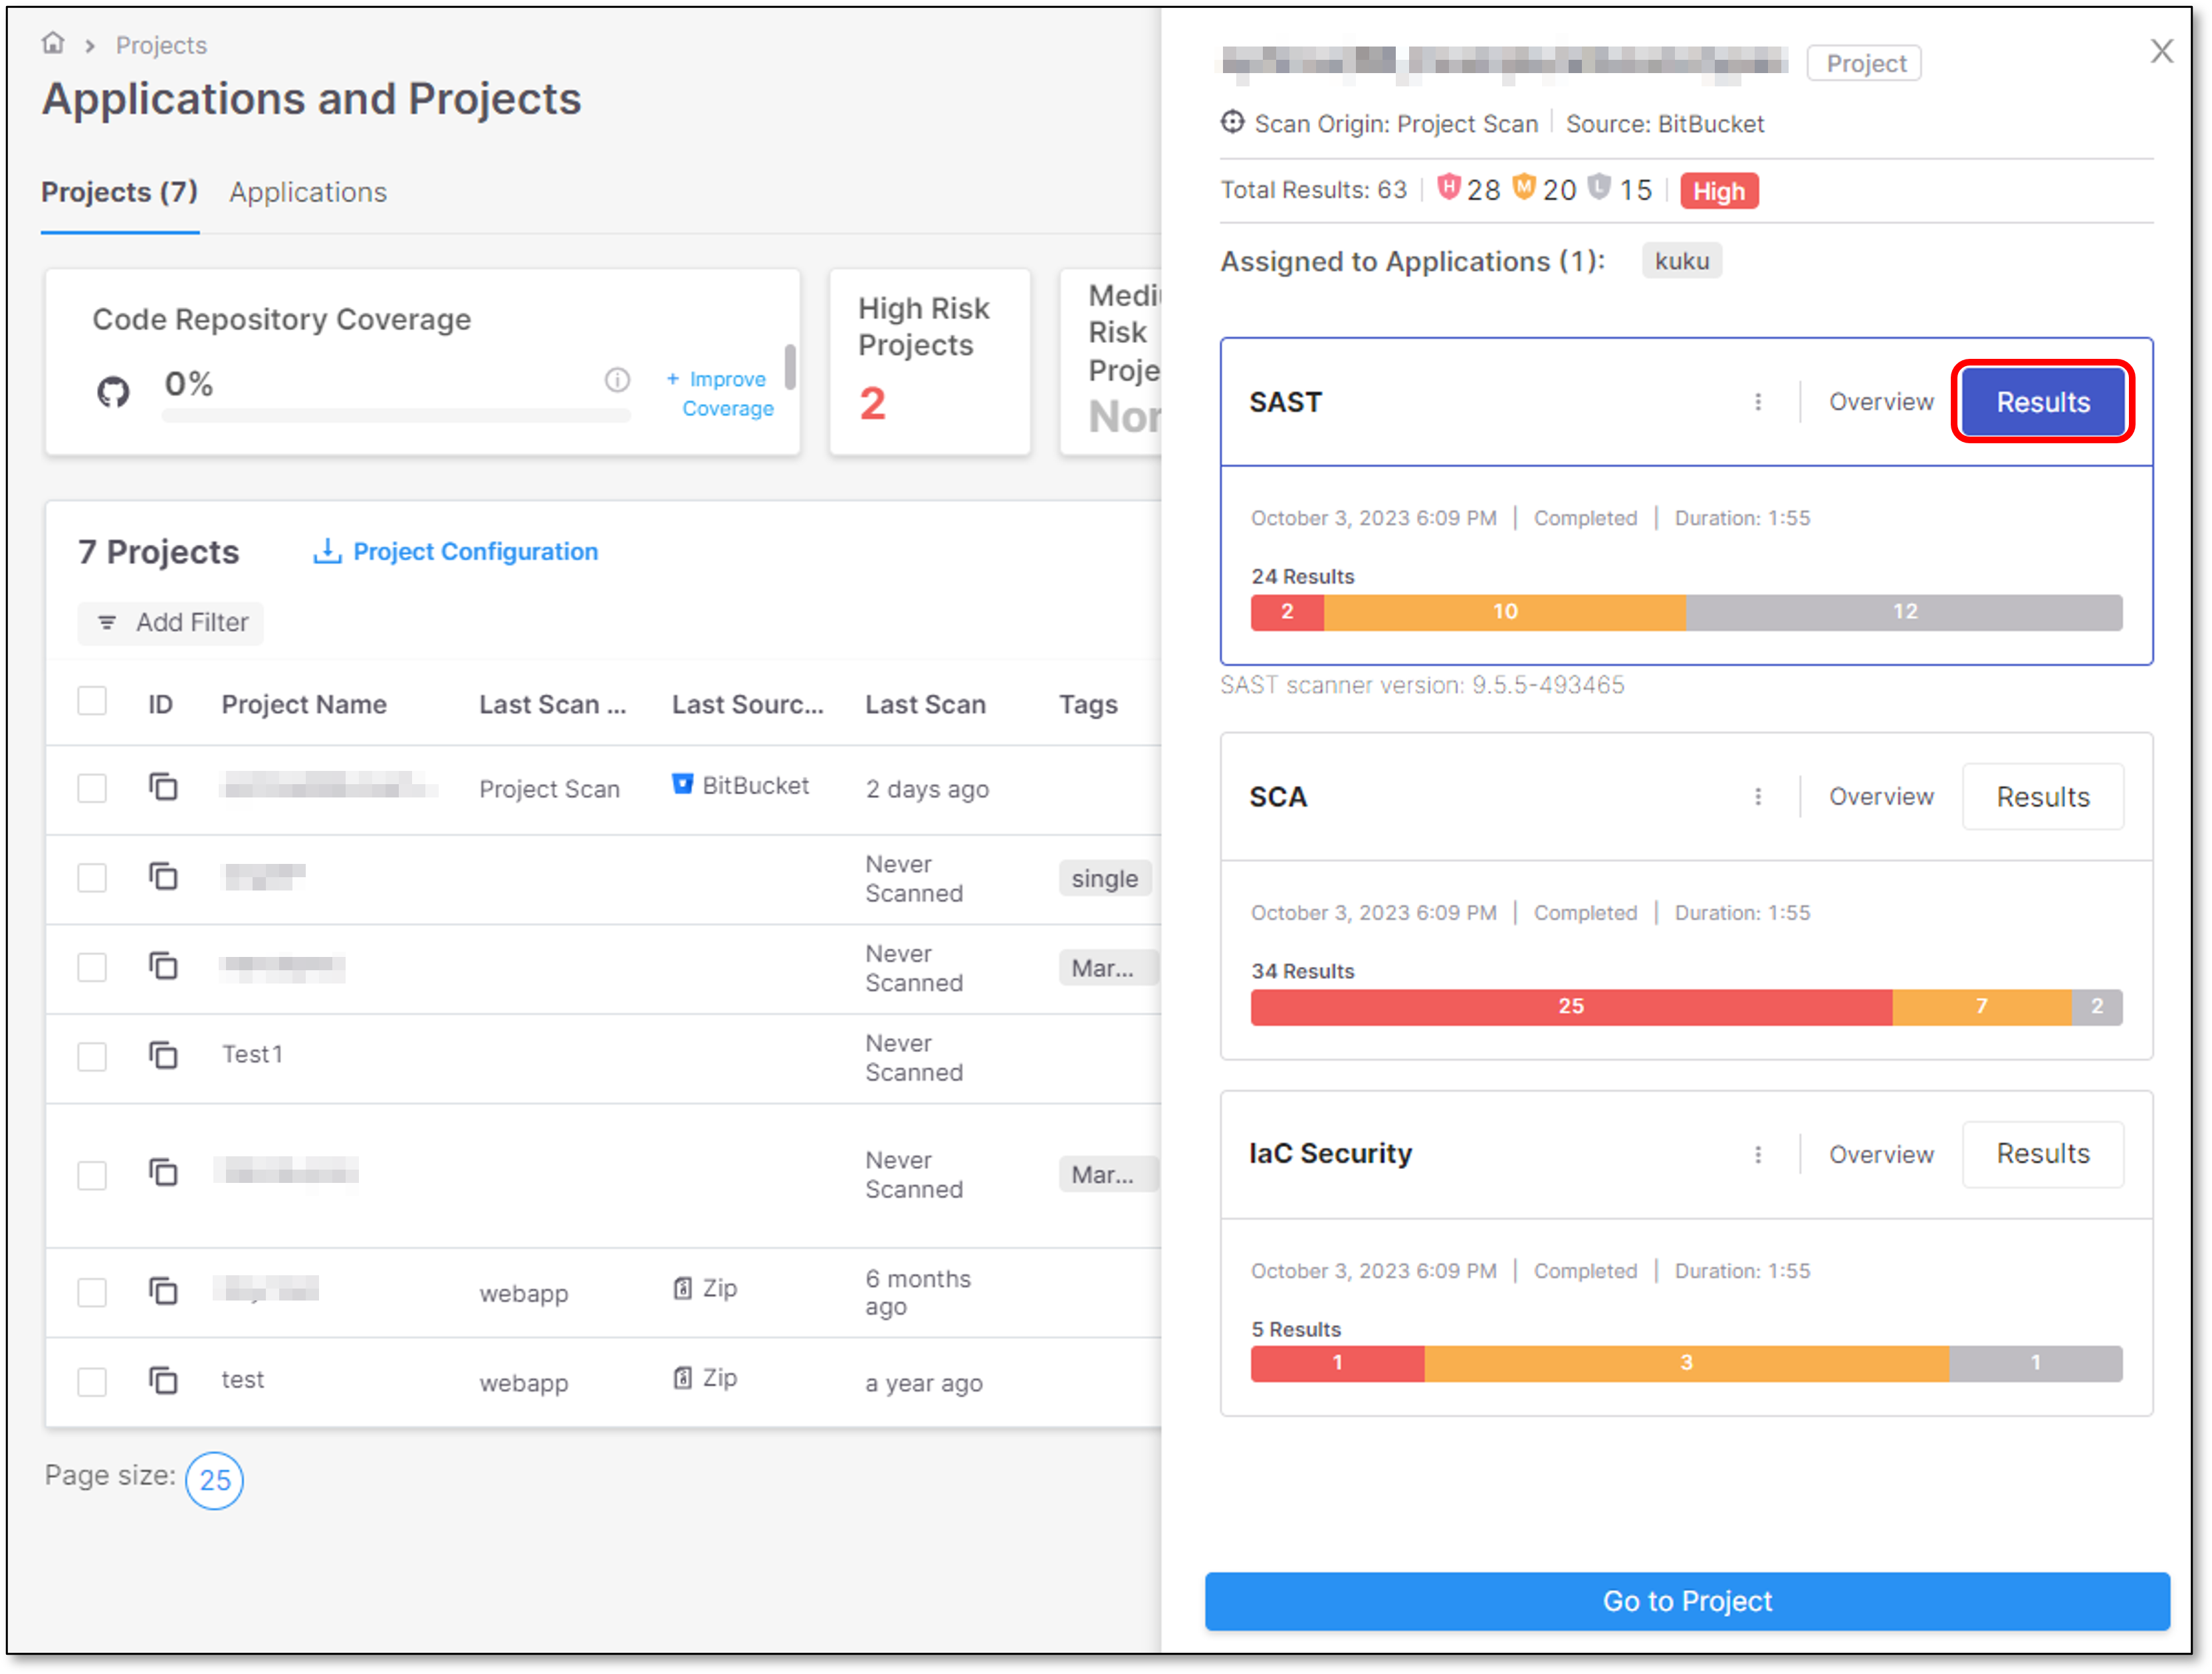
Clicking on a specific scan opens a preview pane on the right screen side. From the Preview pane it is possible to open the Scan Results page for that specific scanner.
Click Results to display the scan results for the requested scanner.
 |
Filtering the Scans List View
Filtering Branches
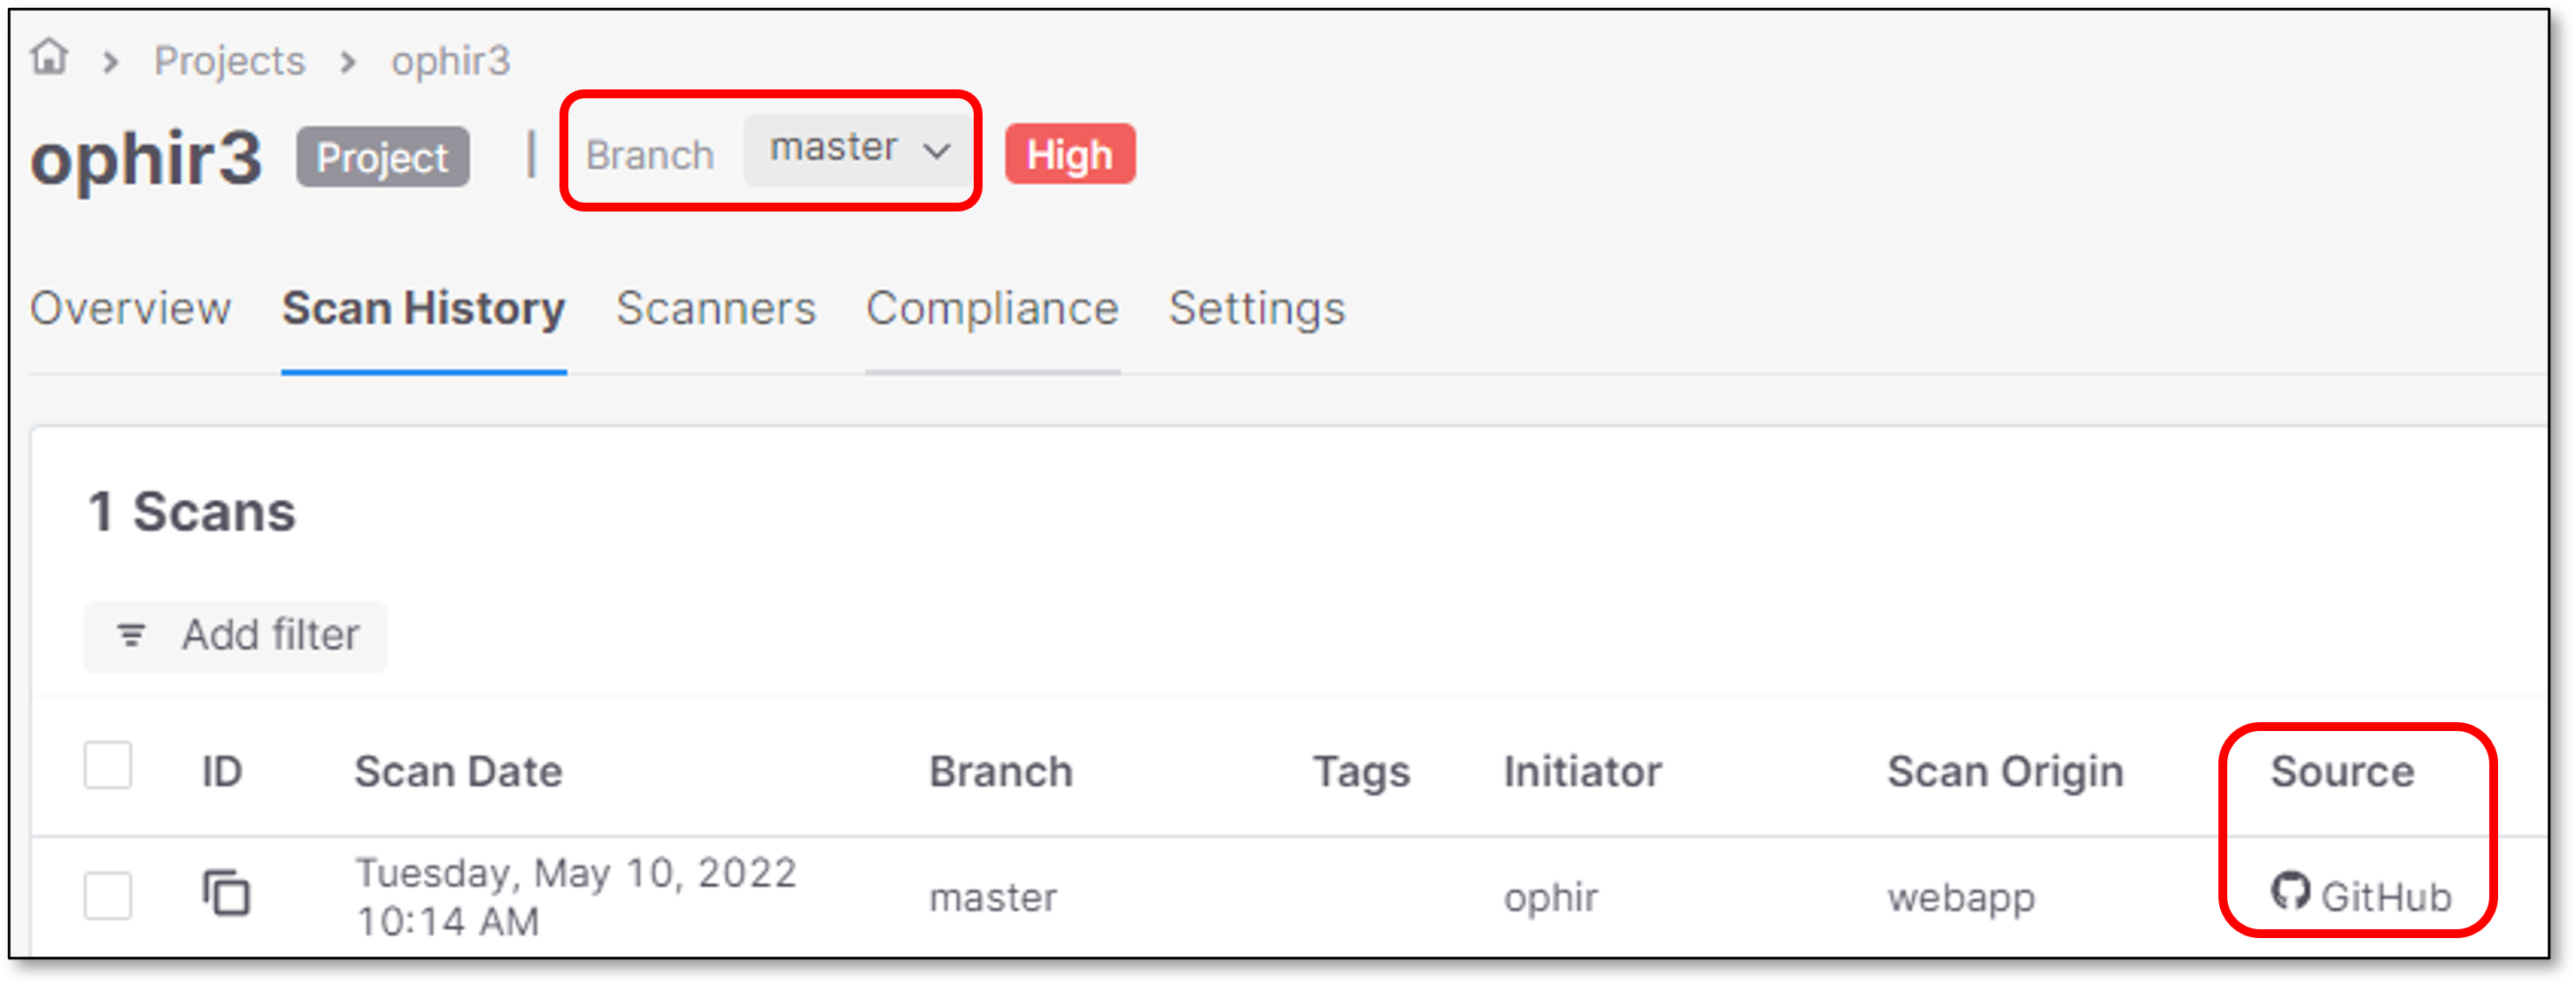
By default, the Scans list is filtered by Branch.
The Scans list view includes only the Repository based scans.
 |
Filtering Zip Files
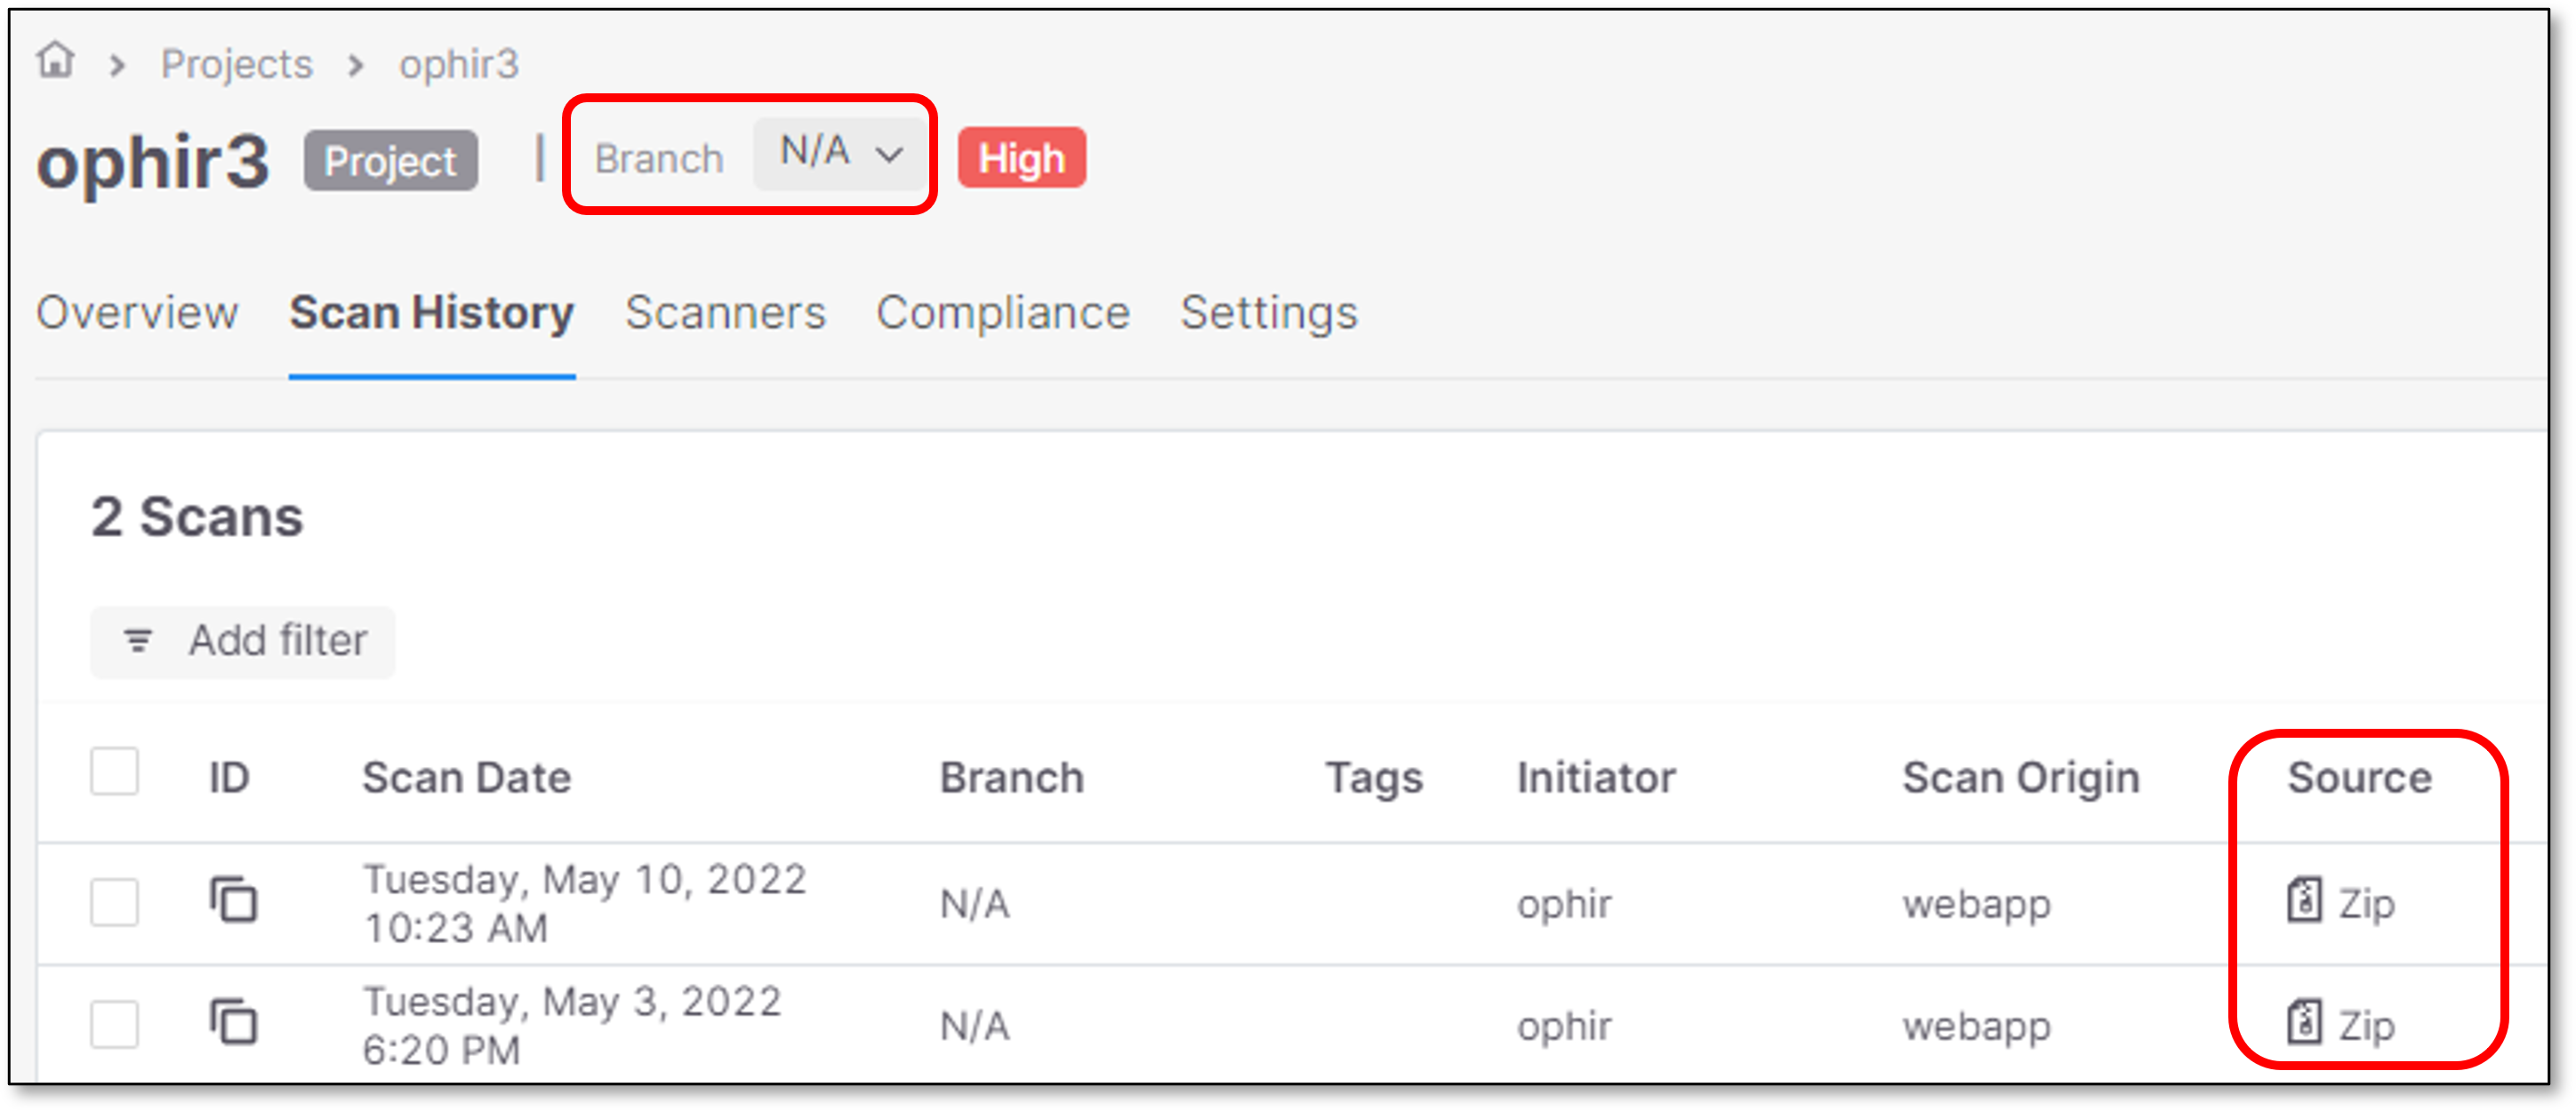
The zip source files filter is configured in Checkmarx One as N/A.
The Scans list view includes only the zip files scans.
 |
Deleting a Scan
You can delete any scan marked as Completed from the Scan History screen.
To delete a scan:
Click
 and then select
 Delete Scan.
Click <OK> to confirm your request.
SAST Scans Comparison
SAST comparison feature is designed for SAST results comparison of 2 SAST scans of the same branch / zip file.
The essence of the feature is to provide the user better understanding on which SAST vulnerabilities were added/fixed/reoccurred in the same repository branch or zip file scans.
Checkmarx One provides an interactive interface for the SAST comparison, like the results interface for a single scan.
Comparing SAST Results
To compare SAST results, perform the following:
Perform at least 2 SAST scans of the same repository branch or zip file.
Open the projects page by using one of the methods that appear in this link Viewing Scan ResultsViewing Scan Results
Click on Scan History
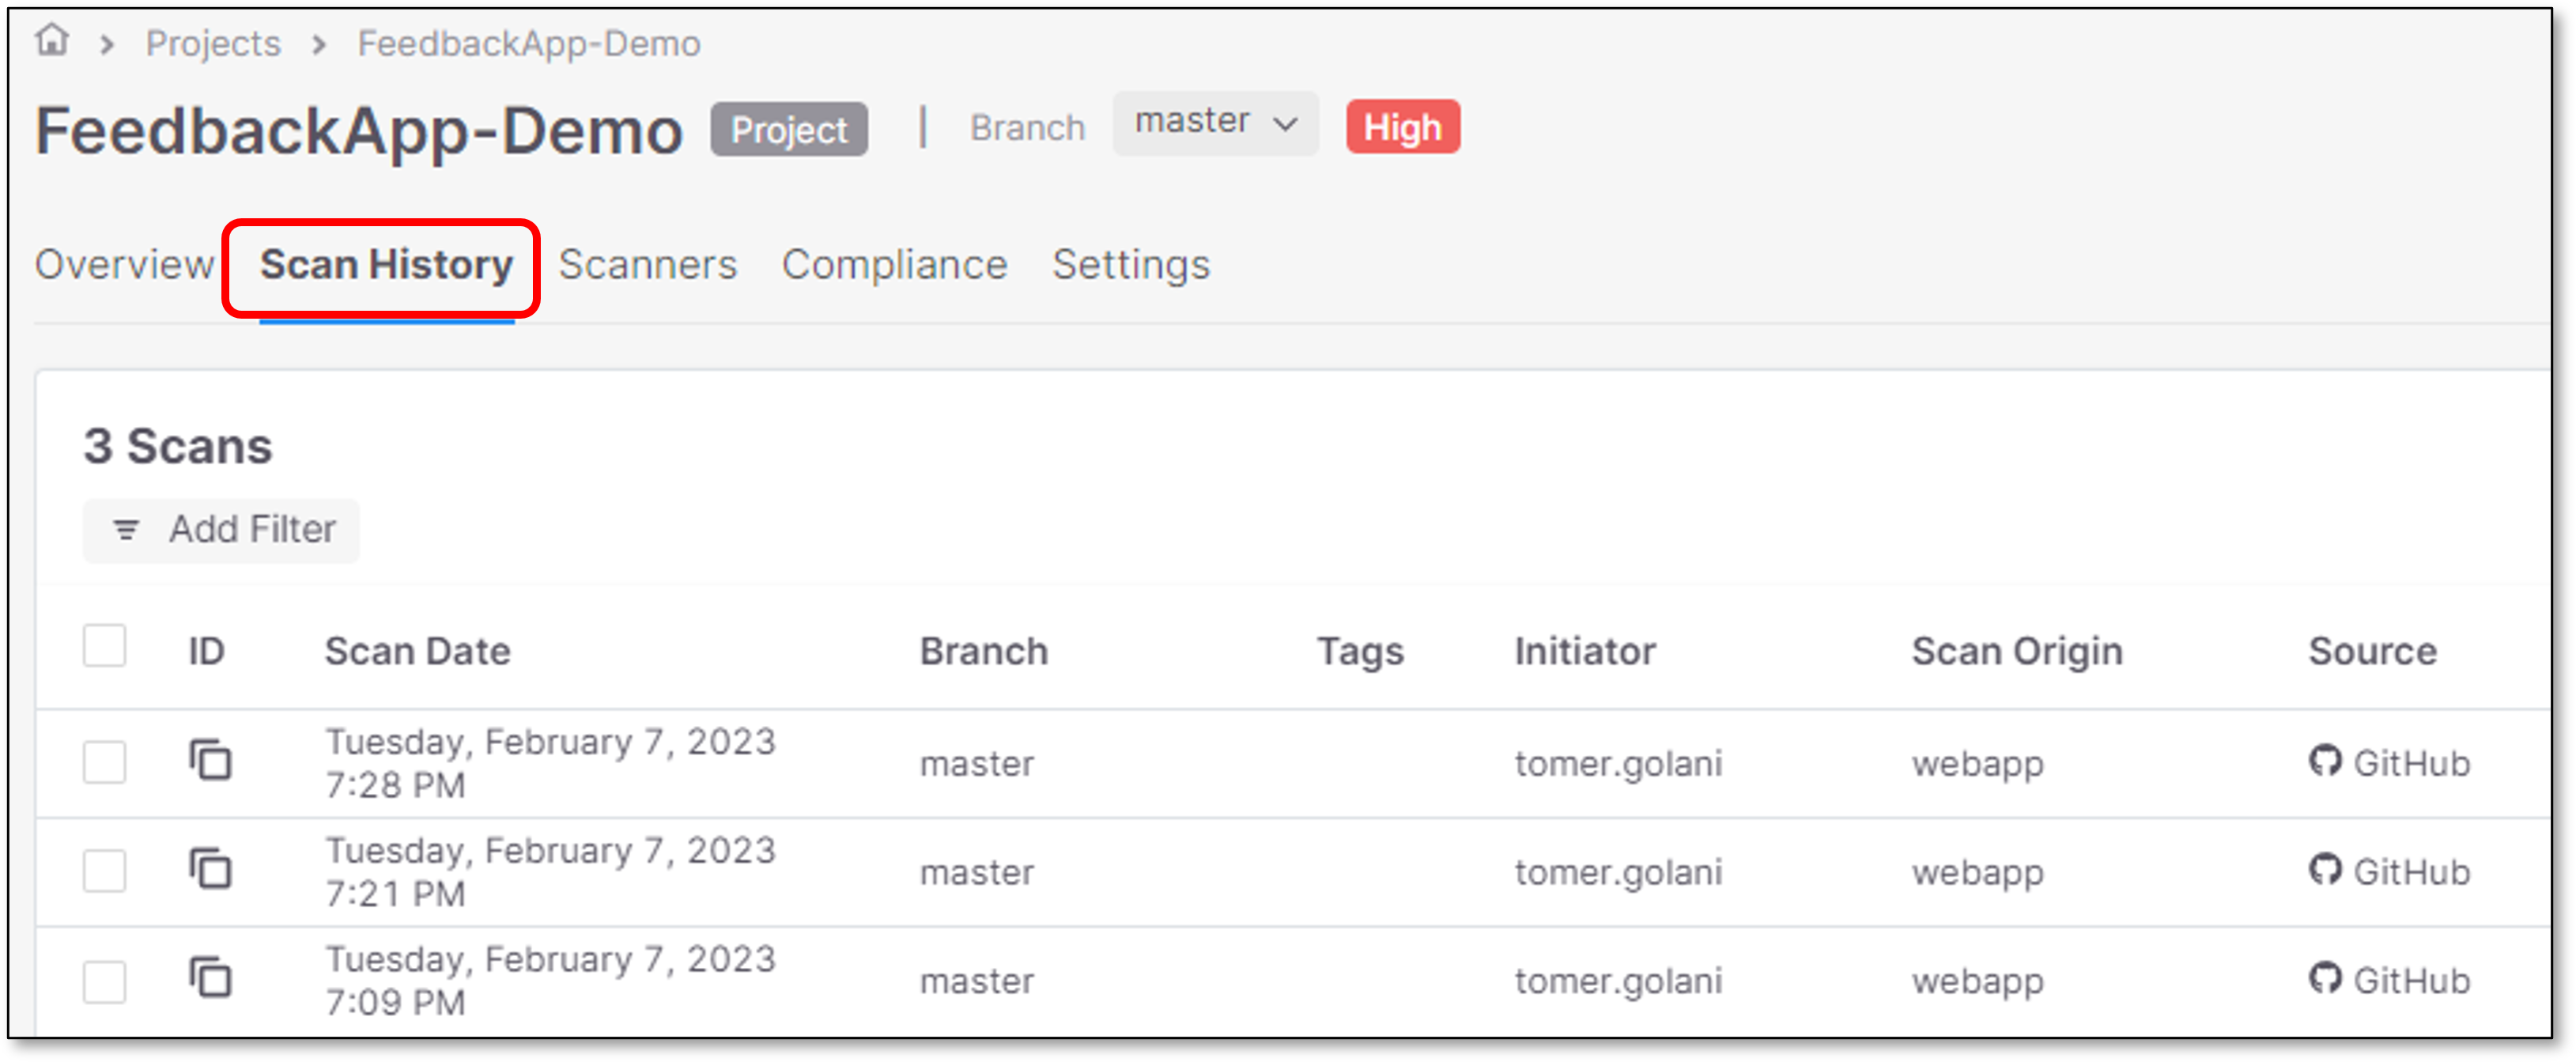
Select 2 scans from the list
Note
The scans can be full scans or incremental.
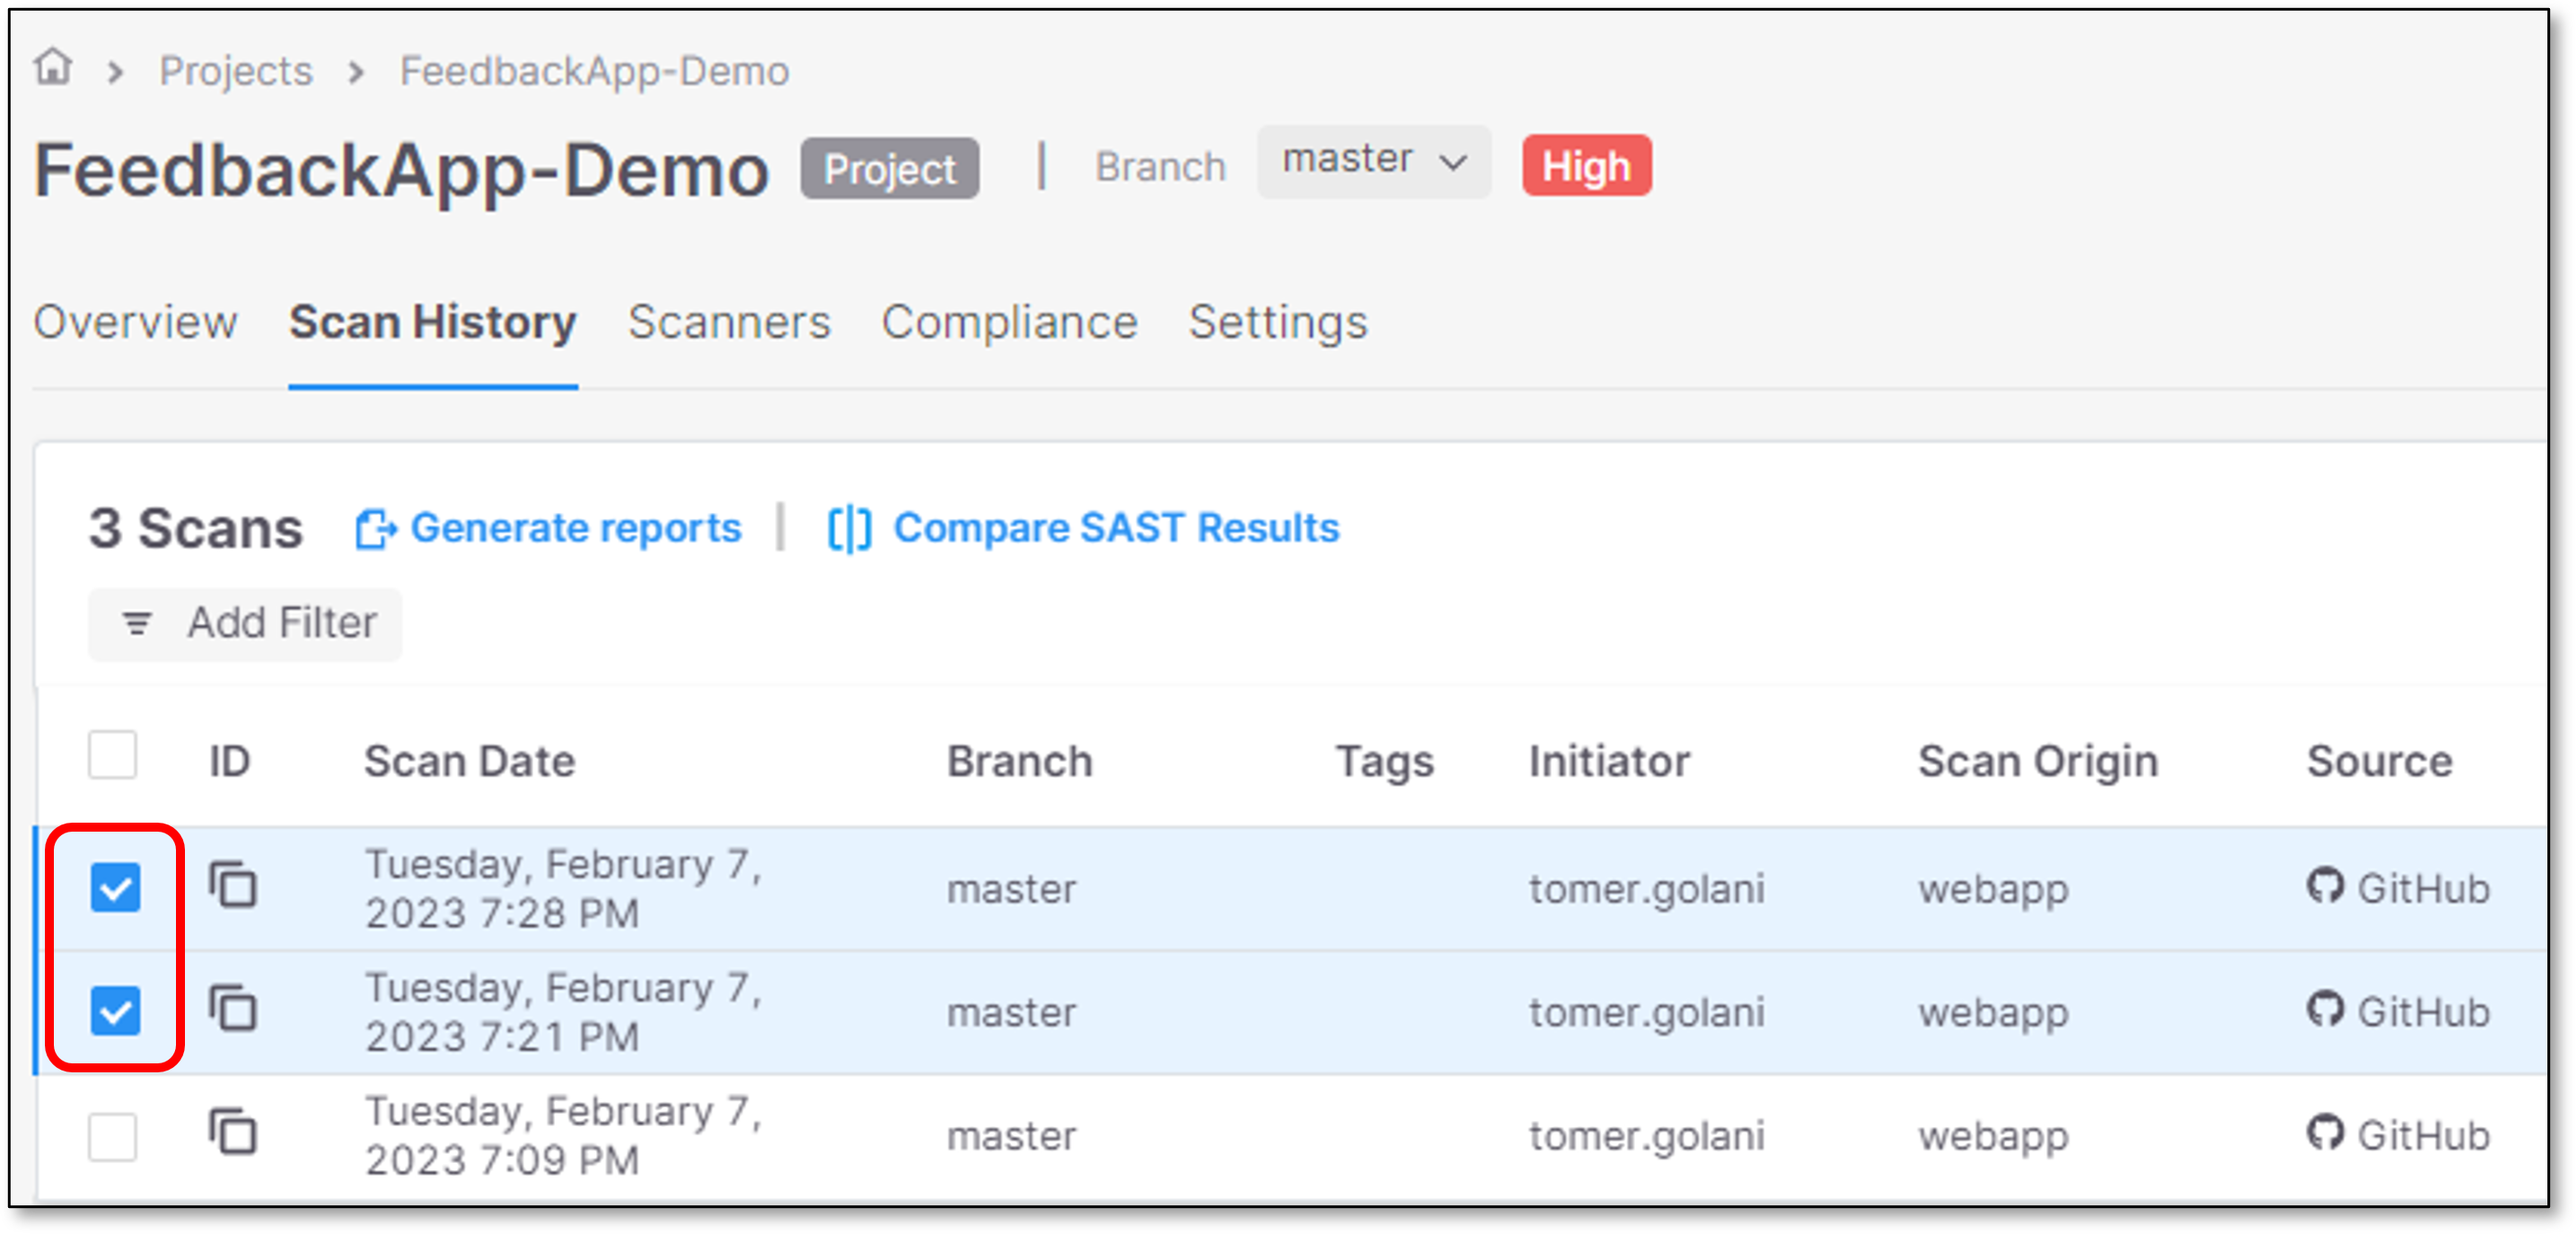
Click on Compare SAST Results
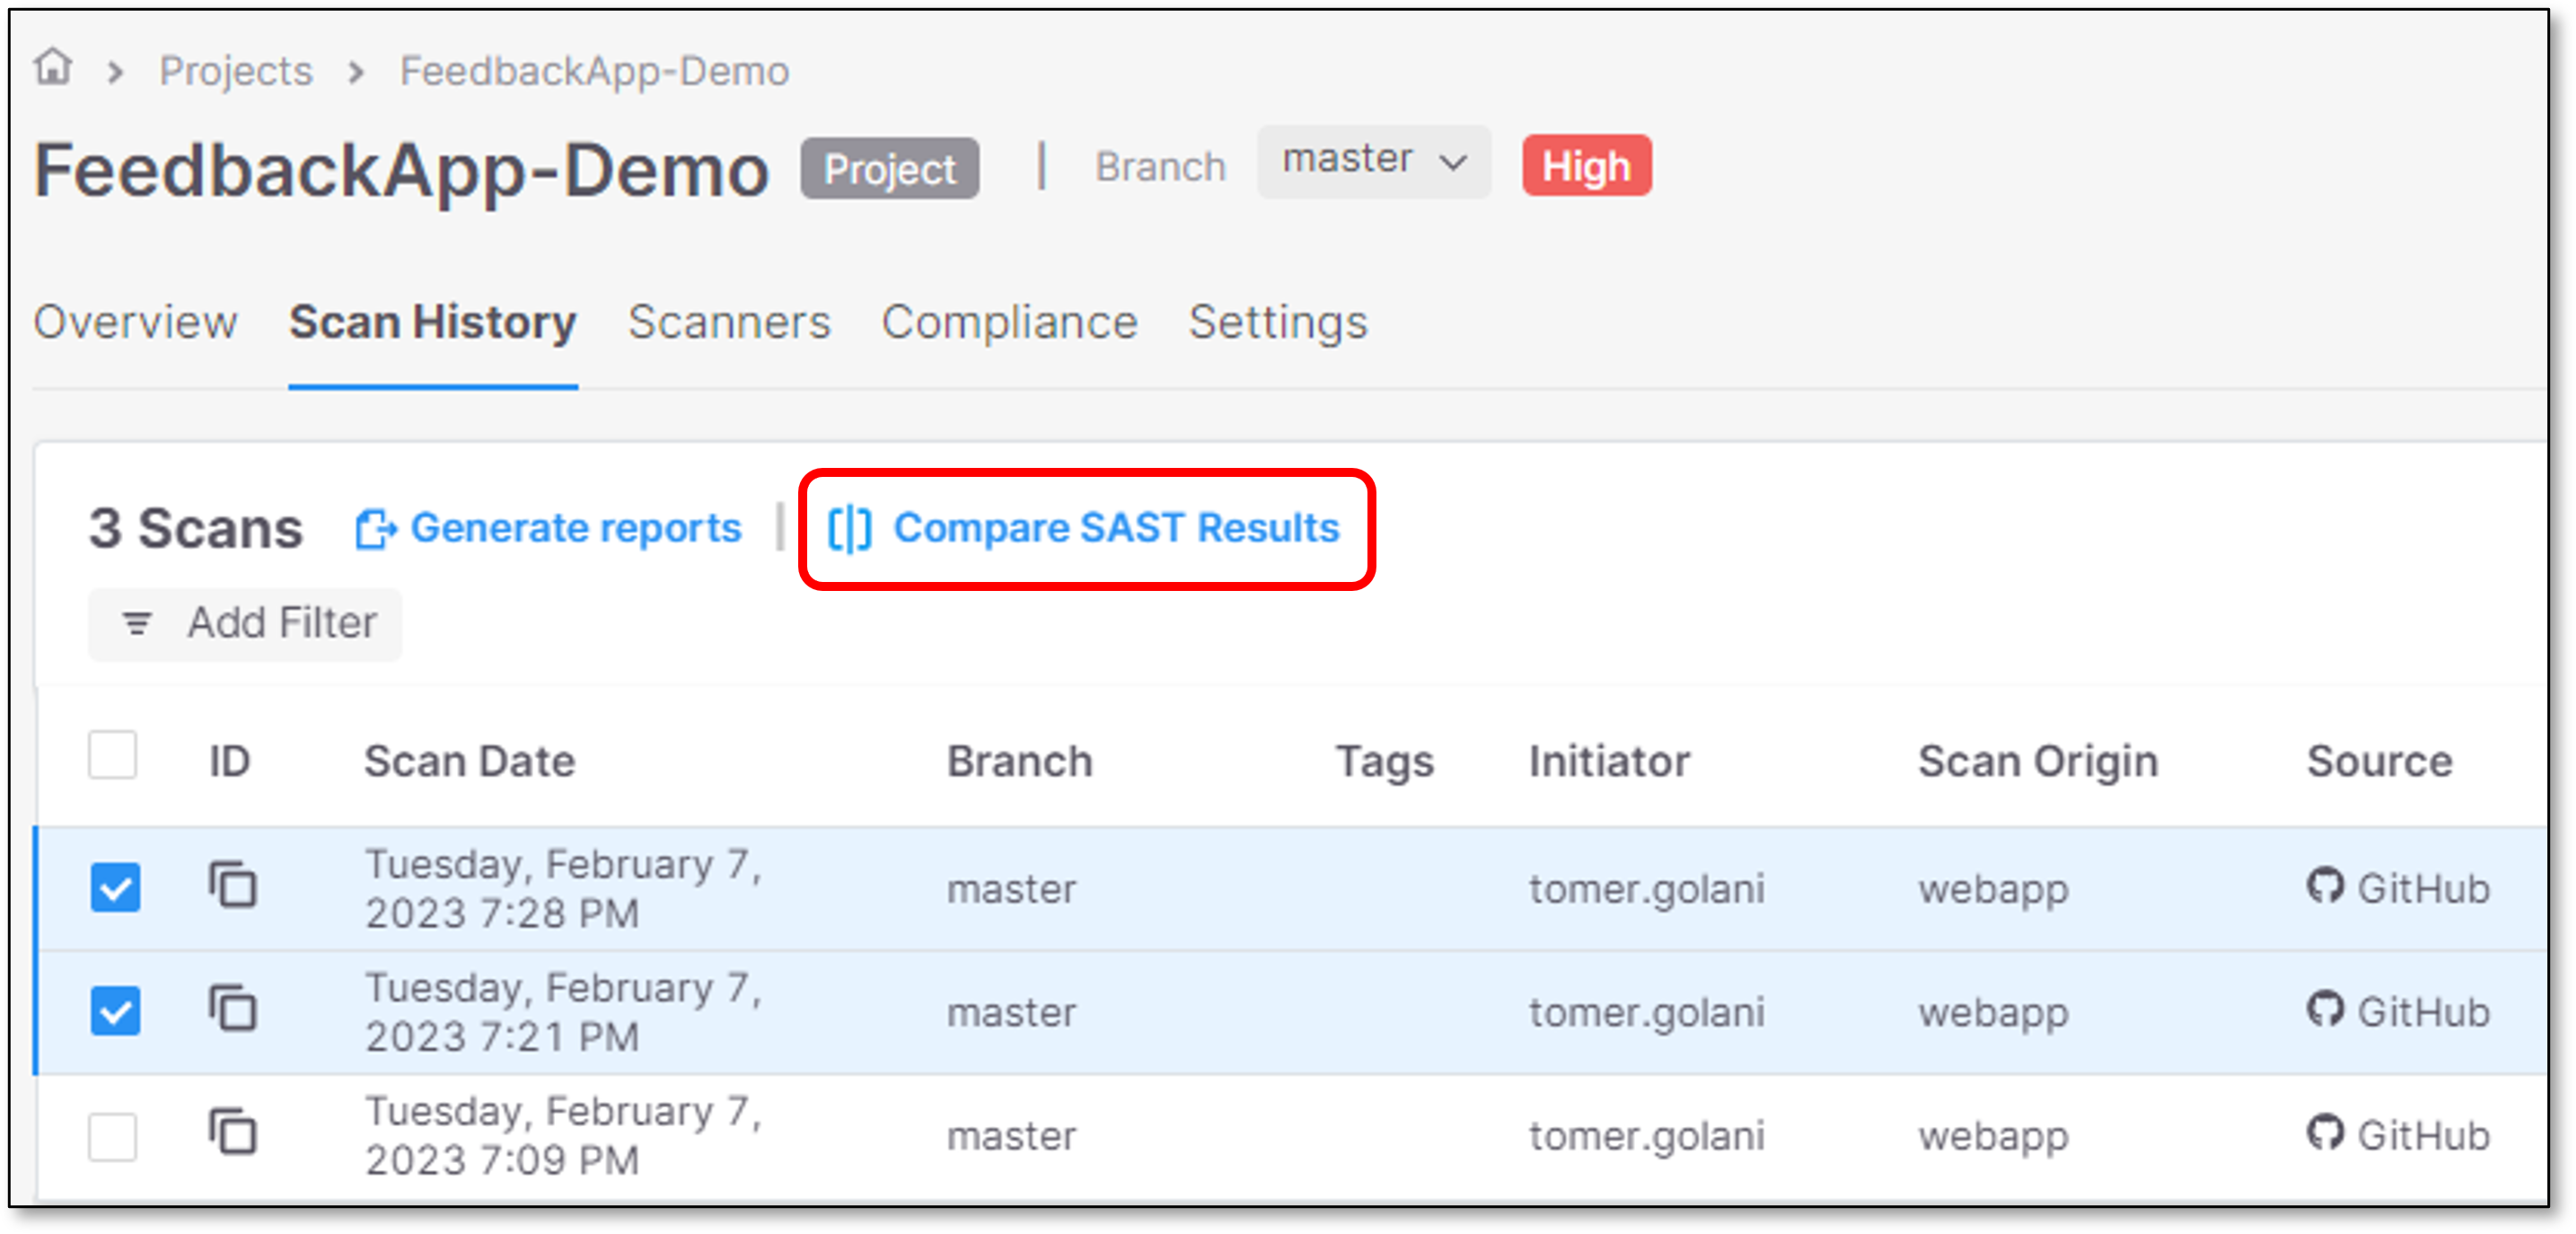
SAST results viewer is opened
Expand the relevant language/vulnerability

Click on one of the findings

SAST code viewer is opened with a comparison between the 2 selected scans
Note
The user will be able to see 3 different results statuses:
New Issues: Issues that were found only in the newer scan.
The user can also add notes, change the state and those changes are reflected in the most recent scan.
Fixed Issues: Issues that were found only in the older scan.
The user can't add notes nor change the state because the result is fixed.
Recurring Issues: Issues that were found in both scans.
The user can also add notes, change the state and those changes are reflected in the most recent scan.
Limitations
The feature supports only SAST scans. If one of the selected scans doesn't contain SAST scanner the comparison option will be greyed out and disabled, with the suitable tooltip.
The comparison is being performed using 2 SAST scans. In case that the user selects more than 2 scans the comparison option will be greyed out and disabled, with the suitable tooltip.
Scanners
The Scanners tab provides an overview of results from each specific scanners used for the last completed scan of the project. The widgets shown in each of the dashboards are explained in the sections below. The following section explains the shared functionality of the dashboard widgets.
Dashboard Widget Functionality
Filter the Widget View
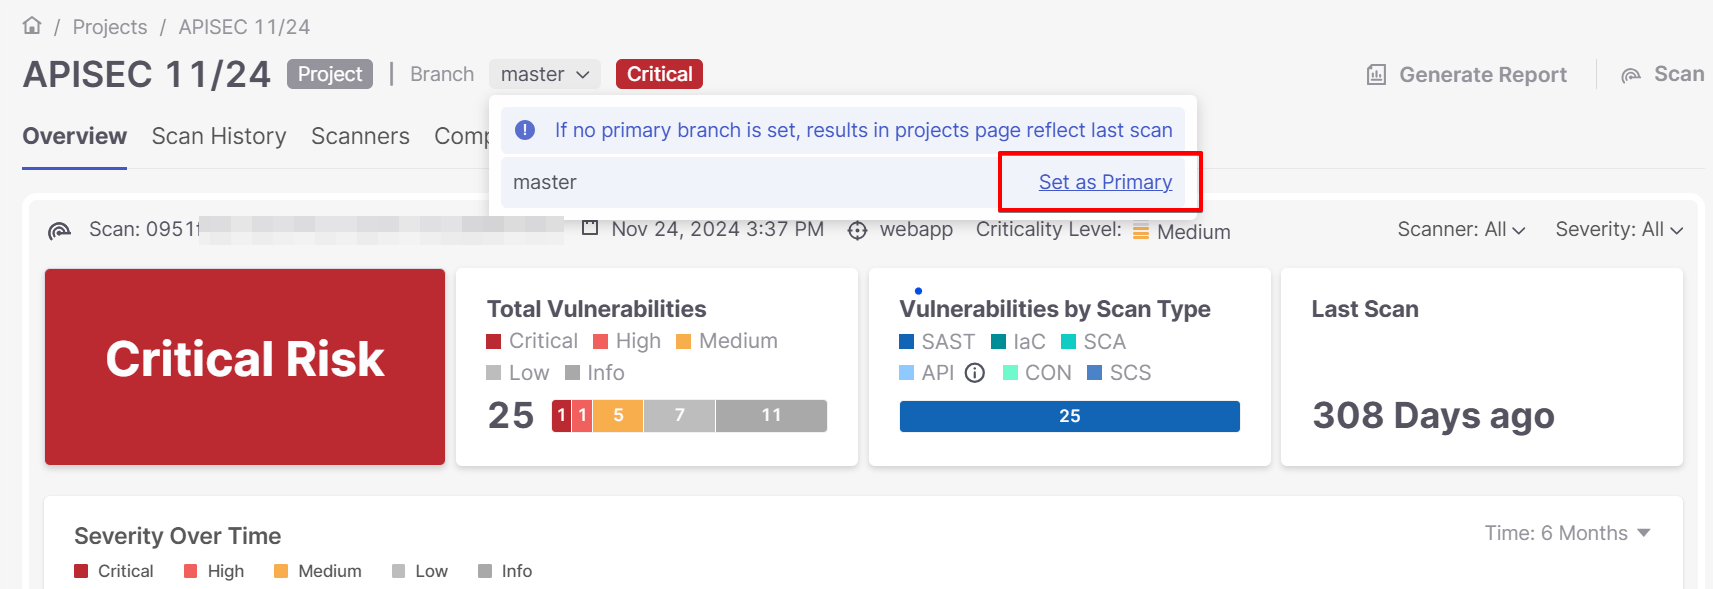
The default widget view is filtered according to the scanned source file branch - Repository scans.
The zip source files view is configured as N/A.
 |
Notice
For repository scanned files the main branch is Master, but it is possible to see also the sub-branches (In case they were scanned).
It is also possible to set any scanned branch as Primary.
If zip source files were scanned in the project, it is possible to switch the widgets view to N/A.
Pie Charts
Note
The illustrated pie charts in this section are from different scans than the previous ones.
You may hide content from the pie charts or display additional information on content as explained below.
To hide content from pie charts:
Click the content Language/State. The relevant content appears crossed out and the result is hidden from the chart as illustrated below.
 |
 |
To display additional information on a result:
Hover over the desired pie chart section, a tooltip appears with information on the content as illustrated below.
 |
SAST Scanner
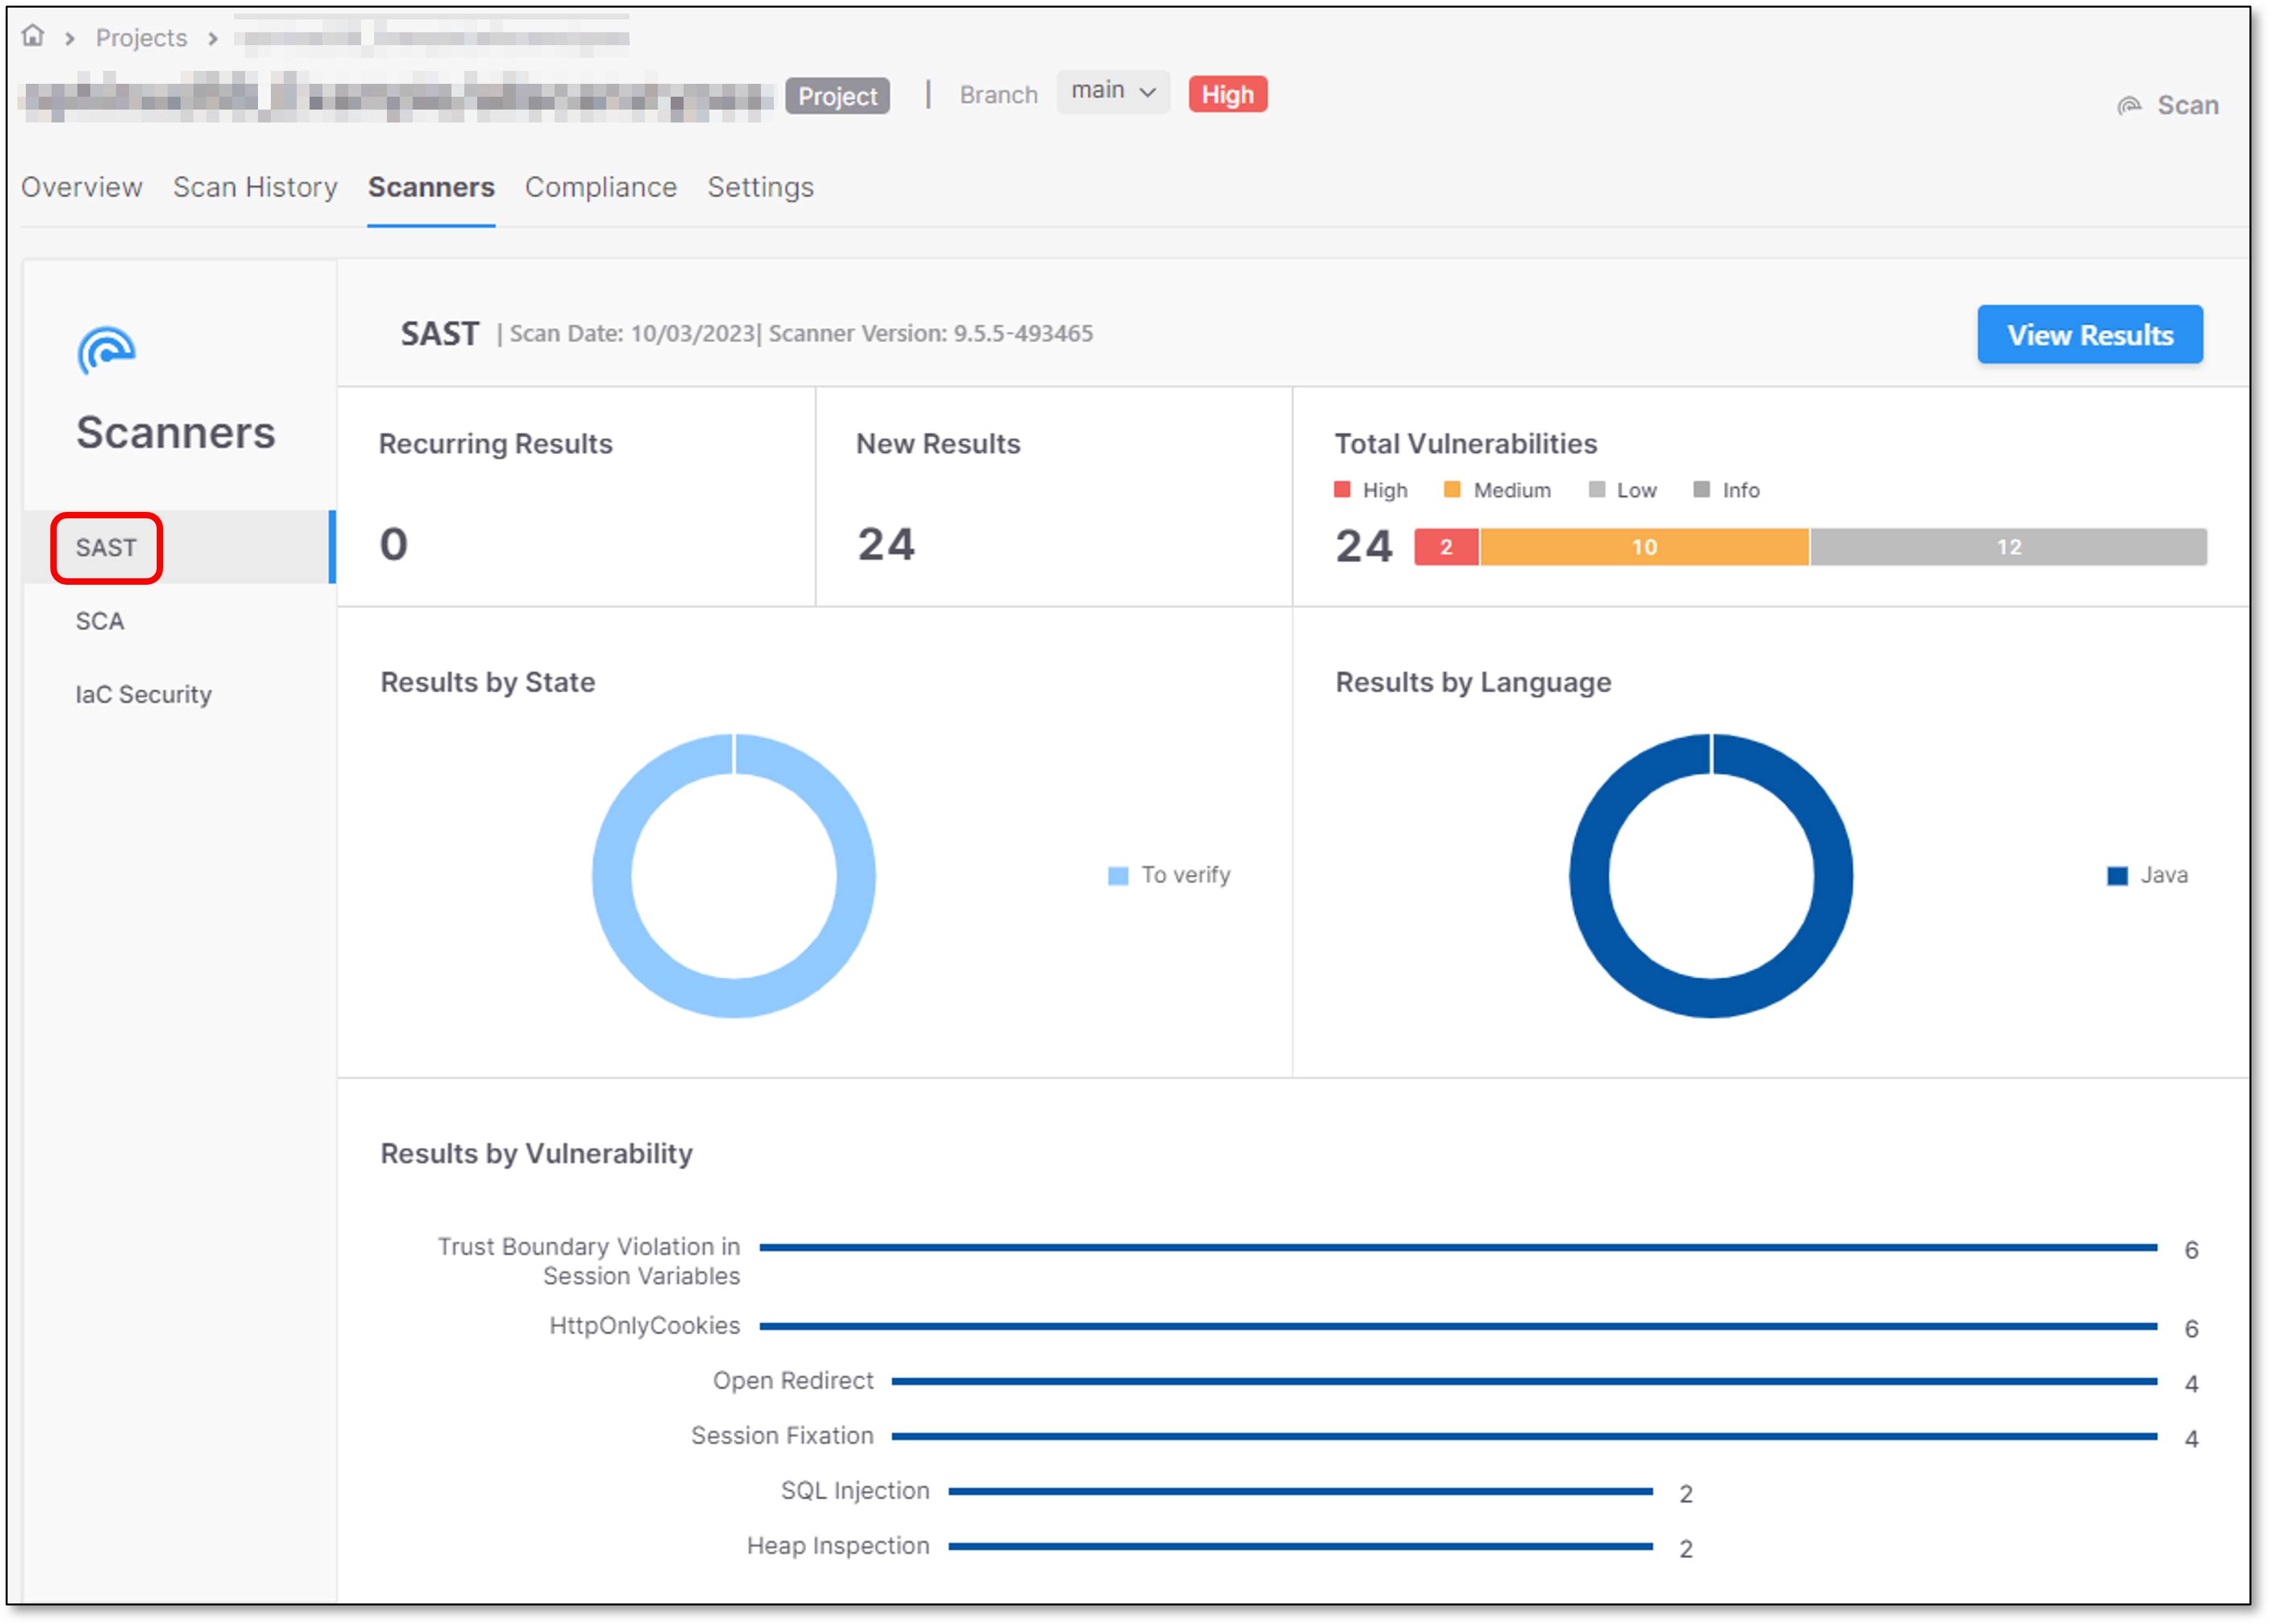
The SAST Scanner screen provides an overview of the last completed SAST scan, using SAST widgets.
 |
SAST Widgets
Recurring Results
Recurring Results widget displays the number of vulnerabilities with “recurrent” status.

New Results
New Results widget displays the number of vulnerabilities with “new” status.

Total Vulnerabilities
Total Vulnerabilities widget displays the total number of vulnerabilities per severity - Critical, High, Medium, Low, Info.

Results by State
Results by State widget presents the number of vulnerabilities per state (To Verify, Confirmed, Not exploitable, etc.).

Results by Language
Results by Language widget presents the number of vulnerabilities per language (VbNet, JavaScript, CSharp, etc.).

Results by Vulnerabilities
Results by Vulnerabilities widget presents the number of vulnerabilities per category (Stored XSS, XPath Injection, etc.).
 |
SAST Results
The SAST Scanner screen offers an option to directly open SAST results.
To open SAST results, click on View Results.
Clicking View Results redirects users to the SAST results filtered view.
For more information about SAST results, refer to Viewing SAST Result.
SCA Scanner
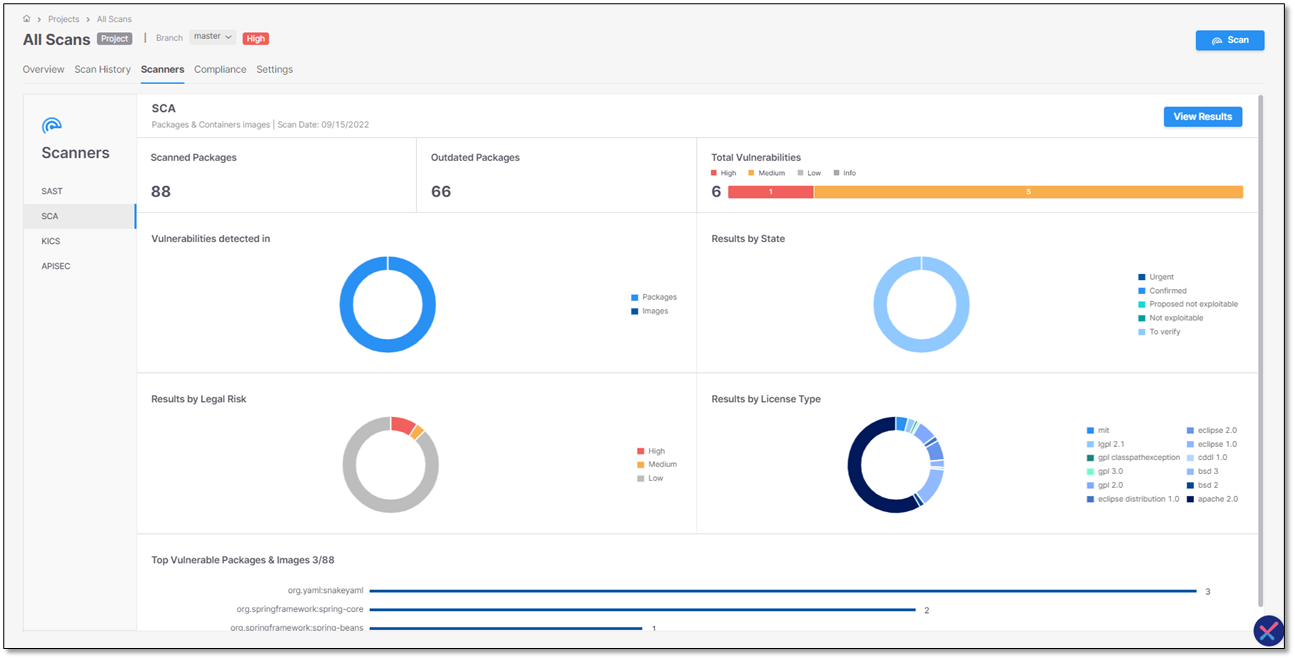
The SCA Scanner screen provides an overview of the last completed SCA scan, using SCA widgets.
 |
SCA Widgets
Scanned Packages
Scanned Packages widget displays the total number of scanned packages.
 |
Outdated Packages
Outdated Packages widget displays the total number of outdated packages (i.e. packages for which a newer version is available) in your Project.
 |
Total Vulnerabilities
Total Vulnerabilities widget displays the total number of vulnerable packages, distributed by severity - Critical, High, Medium, Low,
 |
Vulnerabilities detected In
Vulnerabilities detected In widget displays the number of vulnerabilities distributed by the type of entity in which they were found (Packages, Images).
 |
Results by State
Results by State widget displays the number of vulnerabilities distributed by the current state of the vulnerability.
 |
Results by Legal Risk
Results by Legal Risk widget displays the vulnerable scanned packages distributed by legal risk severity - Critical,High, Medium, Low, Unknown.
 |
Results by License Type
Results by License Type widget displays the vulnerable scanned packages per license type - zlib, public domain, mit, mozilla 1.1 etc.
 |
Top Vulnerable Packages
Top Vulnerable Packages widget shows the packages with the highest number of vulnerabilities. For each package, the number of vulnerabilities associated with that package is listed, for example org.yaml:snakeyaml has 3 vulnerabilities.
 |
SCA Results
The SCA Scanner screen allows you to directly open SCA results.
To open SCA results, click on View Results.
Clicking View Results redirects users to the SCA results pages.
For a description of the information displayed on the SCA Results pages, refer to Viewing SCA Results.
IaC Security Scanner
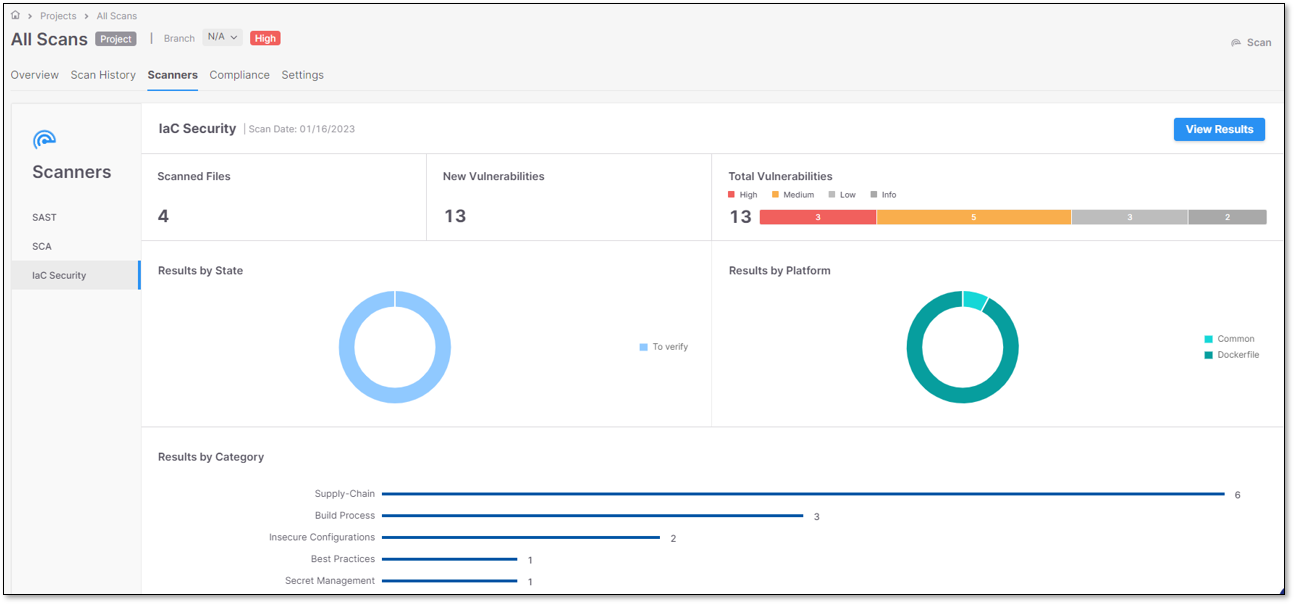
The IaC Security Scanner screen provides an overview of the last completed IaC Security scan, using IaC Security widgets.
 |
IaC Security Widgets
Scanned Files
Scanned Files widget presents the number of scanned files.
 |
New Vulnerabilities
New Vulnerabilities widget presents the number of vulnerabilities with new status.
 |
Total Vulnerabilities
Total Vulnerabilities widget presents the total number of vulnerabilities per severity - Critical, High, Medium, Low, Info.
 |
Results by State
Results by State widget presents the number of vulnerabilities per state (To Verify, Confirmed, Not exploitable, etc.).
 |
Results by Platform
Results by Platform widget presents the number of vulnerabilities per platform (Common, Dockerfile, Kubernetes, etc.).
 |
Results by Category
Results by Category widget presents the vulnerabilities distribution per Category (Insecure Configurations, Access Control, Resource Management, etc.).
 |
IaC Security Results
IaC Security Scanner screen provides the option to directly open IaC Security results.
To open IaC Security results, click on  . It will redirects users to the IaC Security results view.
For additional information on IaC Security results, go to IaC Security Results Viewer.
API Security Scanner
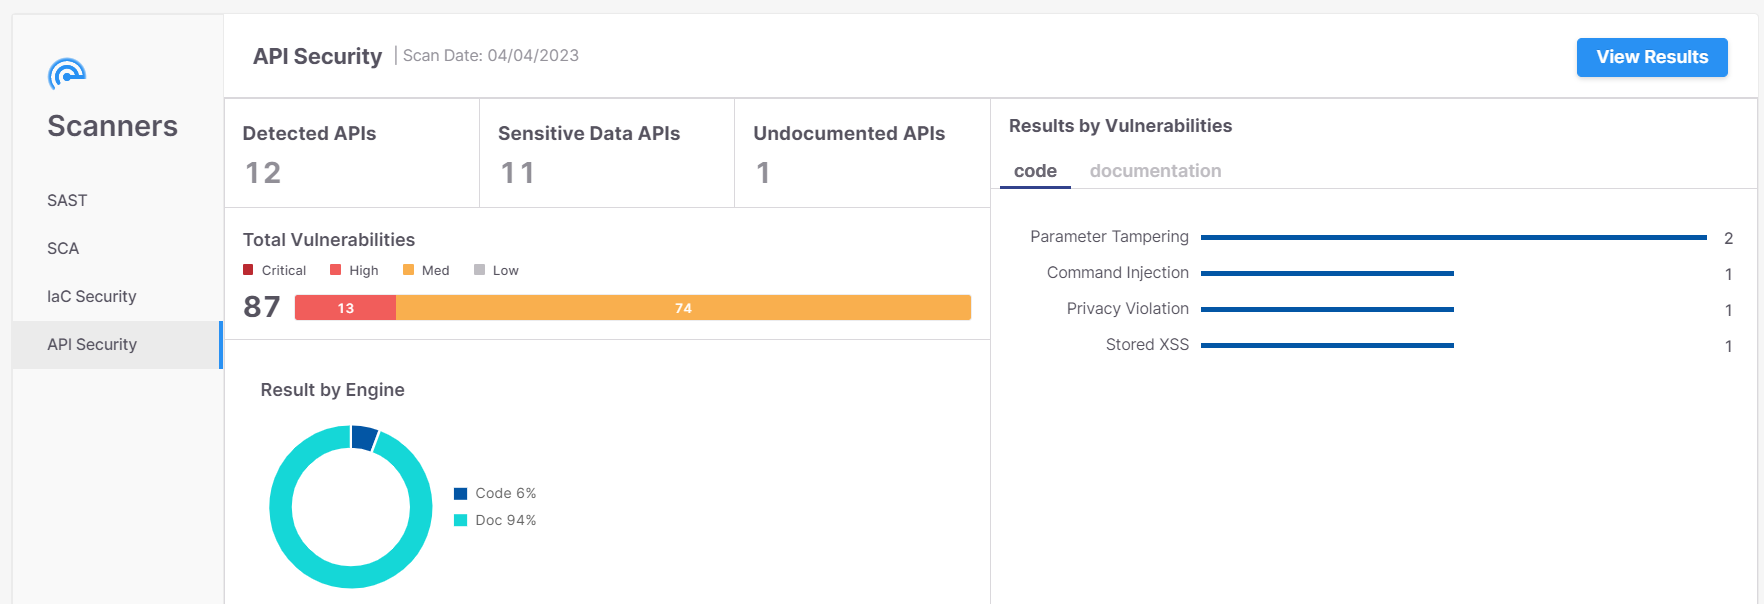
The API Security Scanner screen provides an overview of the last completed API security scan using API Security widgets.
 |
API Security Widgets
Detected APIs
The number of detected APIs in the code. This scan detected 10 APIs in the code.
 |
Sensitive Data APIs
The number of APIs with at least one sensitive data attribute. This scan detected sensitive data attributes in 9 out of the 10 detected APIs. Sensitive Data categories and parameters are listed in the table below.
 |
Category | Parameters |
|---|---|
Name | firstname, surname, familyname, fullname, name |
Personal Data | birthday, dob, dateofbirth, phone, mobile, email, socialsecurity, ssn, driverslicense |
Address | address, zipcode |
Bank | credit, cardnumber, account |
Secrets | credentials, secret, auth, apikey, pass, pwd, password |
Undocumented APIs
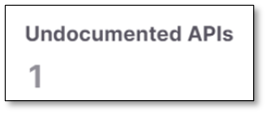
Lists the number of undocumented API endpoints found in the code but not in the Swagger file after scanning both the code and the documentation.
In the illustrated example, API Security detected Undocumented APIs once.
Results by Vulnerabilities
A list of sensitive data attributes with an indicator on how often each of these sensitive data attributes was detected.
In the illustrated example, API Security detected Parameter Tampering twice and three more once each.
 |
Results by Risk
The number of sensitive data attributes according to their risk.
In the illustrated example, API Security detected 5 vulnerabilities of which 2 were of high risk and 3 of medium risk.
 |
Viewing Results
To view results, click View Results. The Risks table appears. It lists the risks and provides additional information detailed in the parameters below and described in Viewing API Results.
 |
Parameter | Description |
|---|---|
Severity | Indicates the risk severity as follows:
|
Risk Name | The name of the risk. |
Status | Indicates the status of the risk as follows:
|
Endpoint Path | The end path of the resource URL. |
Method | The operation that the endpoint performs on resources. |
Data Origin | Indicates where the risk was detected, for example inside the code. |
Risk Discovered | The date when the risk was detected. |
Doc | Undocumented APIs present a risk because attackers may use them as an undetectable surveillance and reconnaissance channel. This column shows whether the endpoint is documented or not:
|
AuthN | Unauthenticated APIs present a risk because they may allow easy access to confidential information. This column shows whether the endpoint is authenticated or not.
|
You can view the parameters of a code risk by clicking its row.
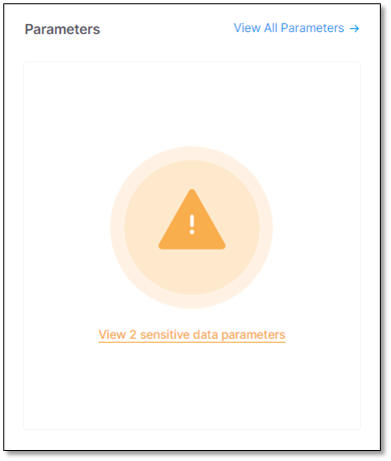
Under Parameters, click
 . All sensitive data parameters in the code appear.
Interface
Description
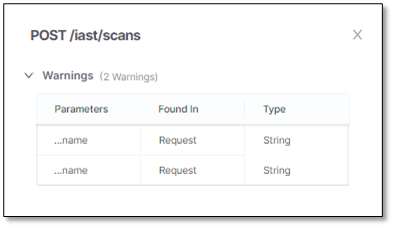
List of all sensitive parameters in the API with warnings. This section is identical to the list of sensitive data parameters.
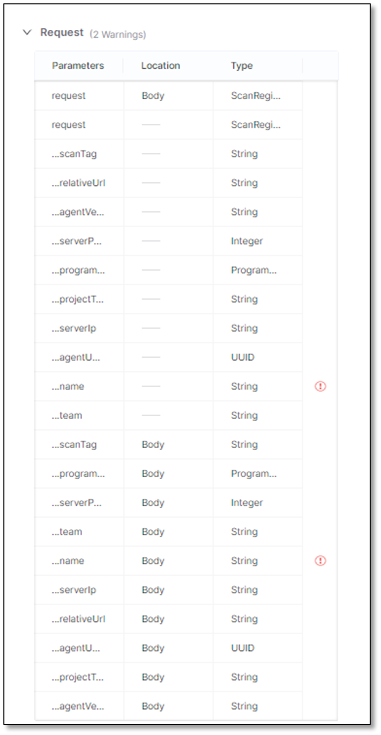
List of all parameters in the request to the API. The sensitive parameters are labeled
 .
.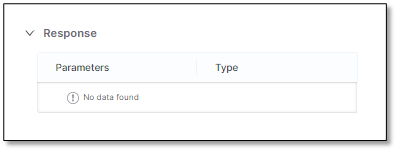
List of all parameters in the response by the API. The sensitive parameters are labeled
 .
.
To view the details of a documentation risk, click its row and the vulnerability in the Swagger file will appear with an embedded description box.
 |
Container Security Scanner
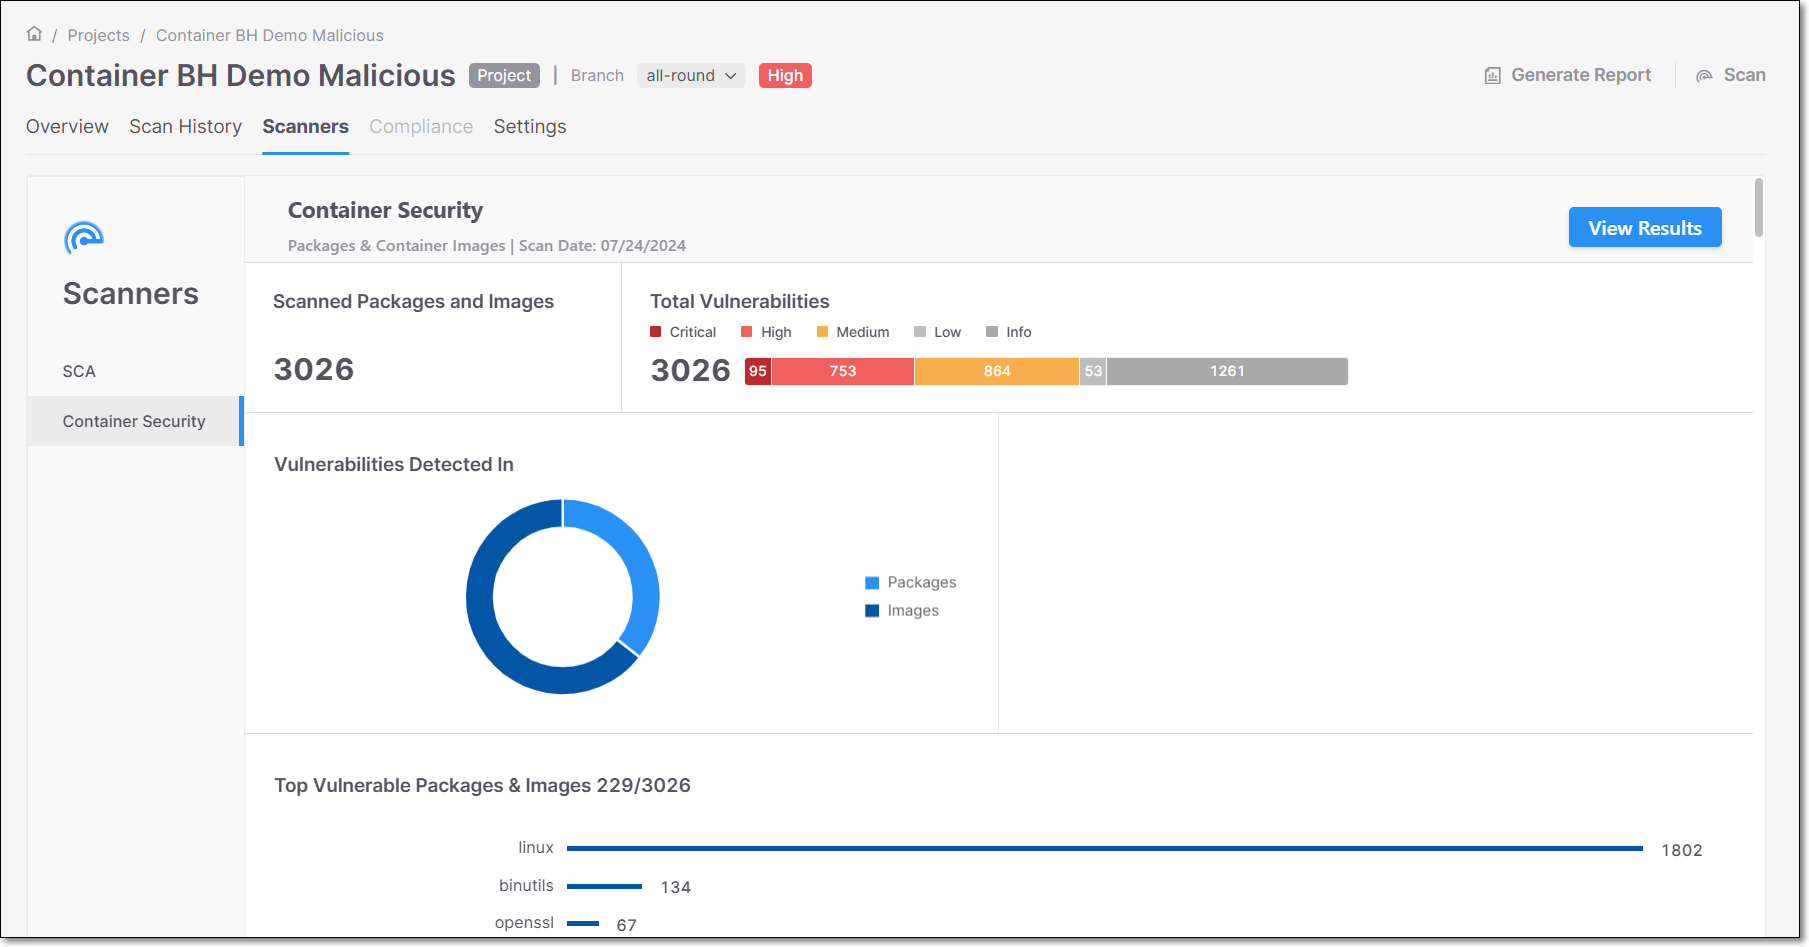
The Container Security screen provides an overview of the last completed Container Security scan, displayed by Container Security widgets.
 |
Container Security Widgets
Scanned Packages and Images
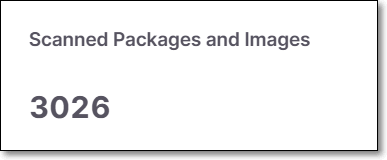
The Scanned Packages and Images widget displays the number of packages and images that were scanned in your project.
 |
Total Vulnerabilities
The Total Vulnerabilities widget displays the number of vulnerabilities discovered in the scan broken down by severity.
 |
Vulnerabilities Detected In
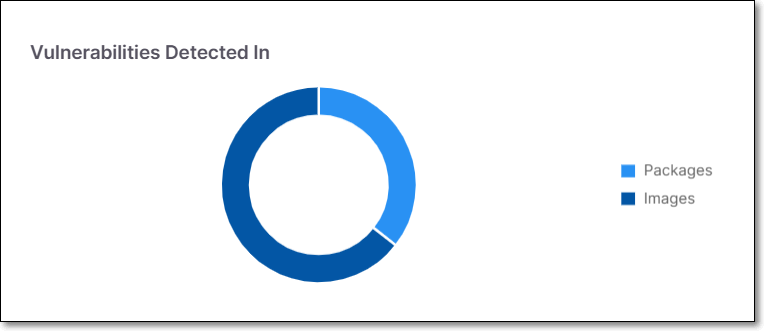
The Vulnerabilities Detected In widget presents a pie chart with a breakdown of the vulnerabilities detected in Packages vs. Images.
 |
Top Vulnerable Packages & Images
The Top Vulnerable Packages & Images widget presents the number of vulnerabilities detected in the packages and images with the most vulnerabilities.
 |
Container Security Results
The Container Security Scanner screen provides the option to open Container Security results.
To open Container Security results, click on  . It will redirect users to the Container Security Results view.
For additional information on Container Security results, go to Container Security Results Viewer.
Compliance
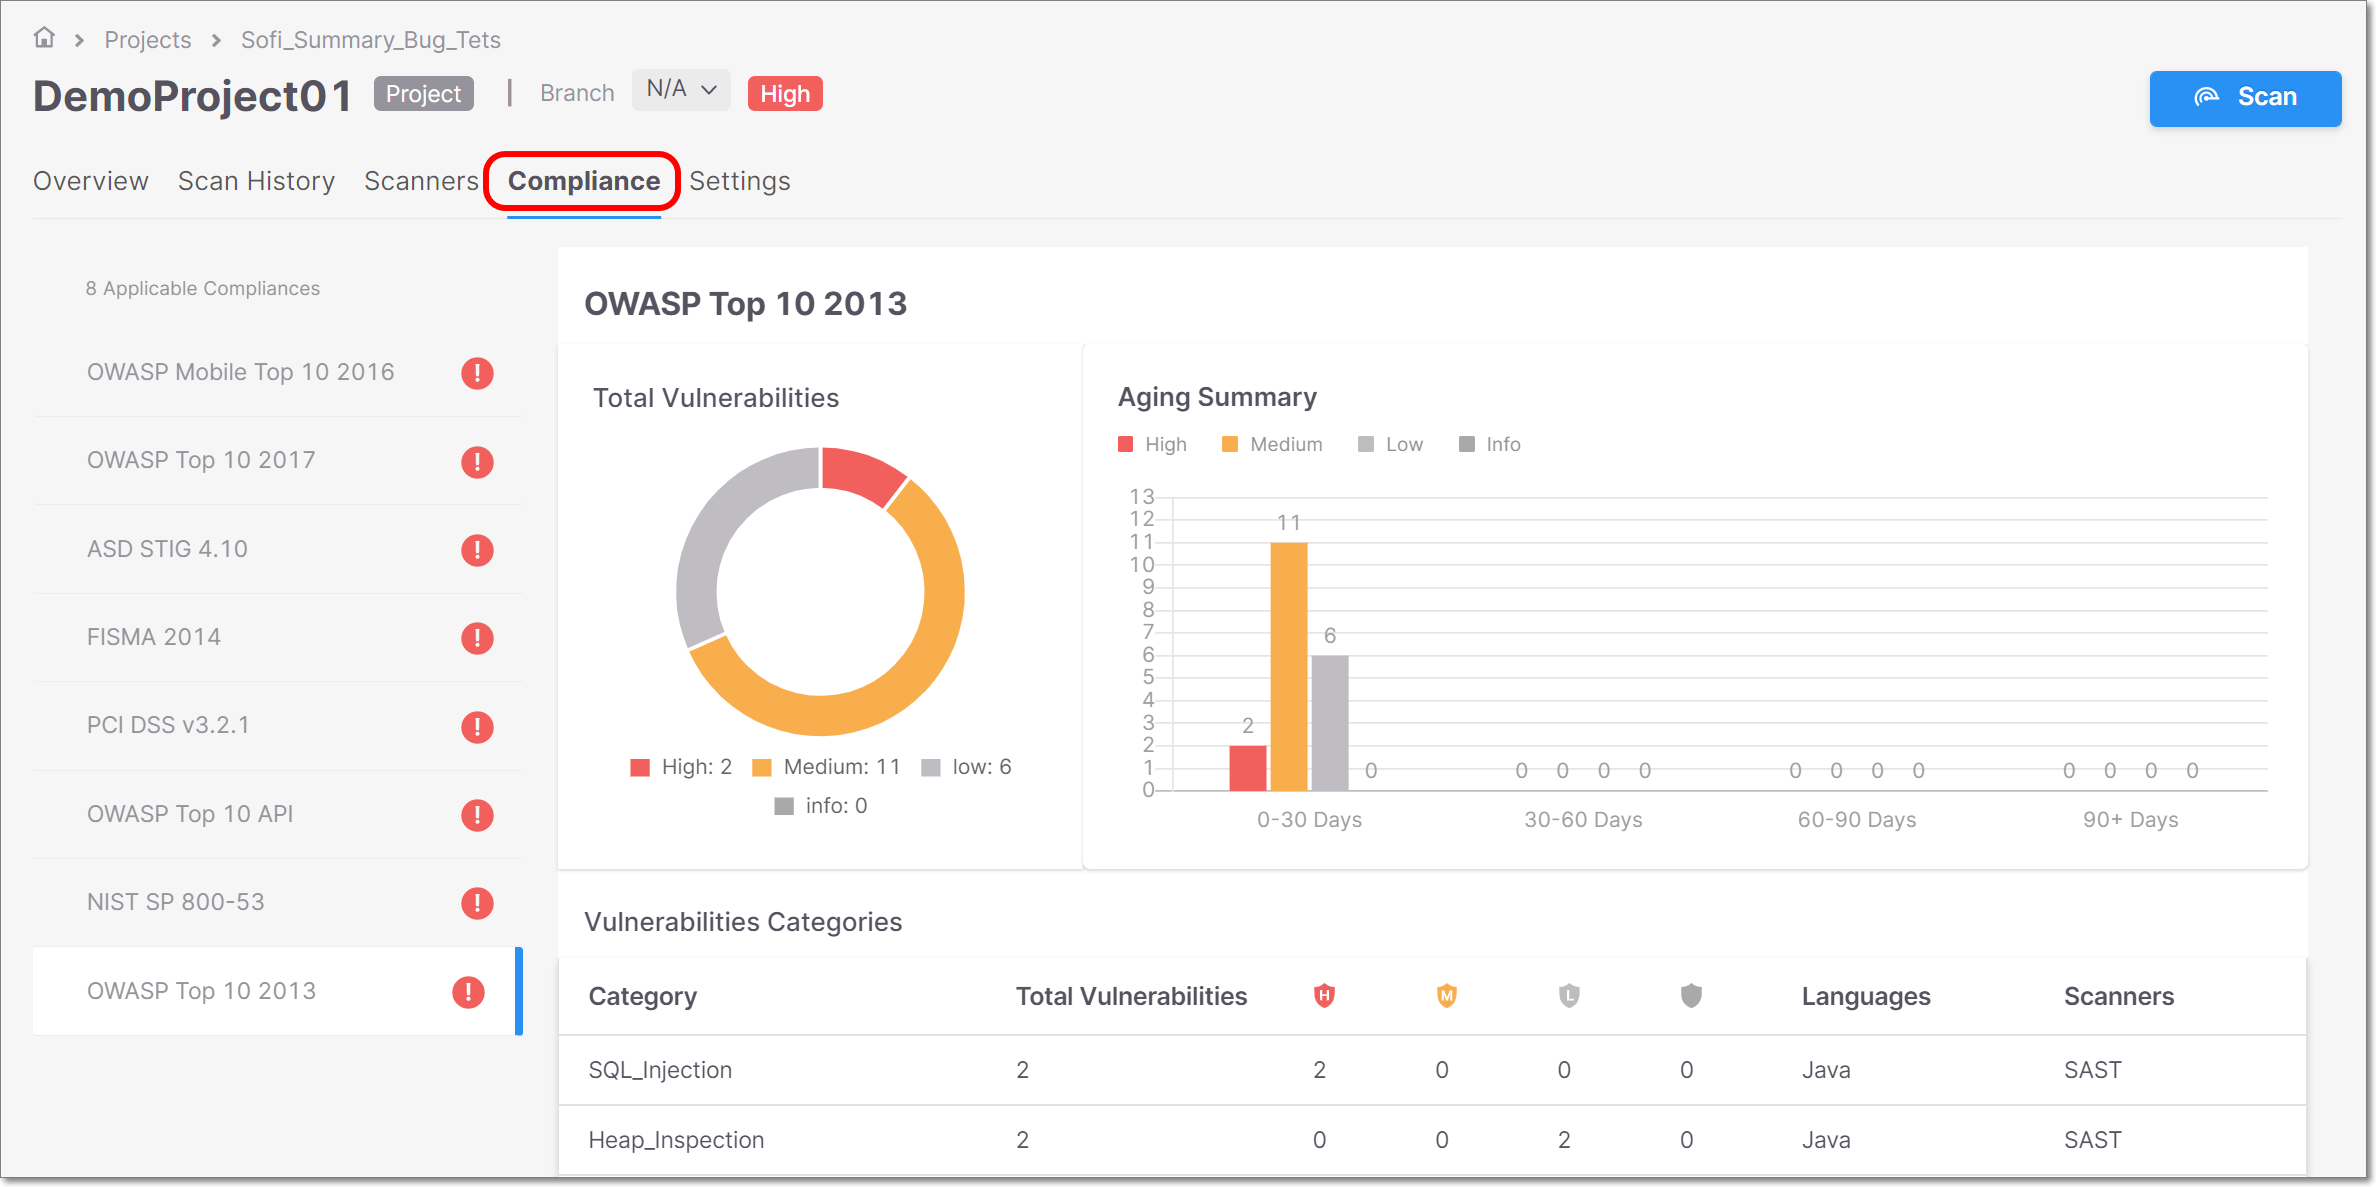 |
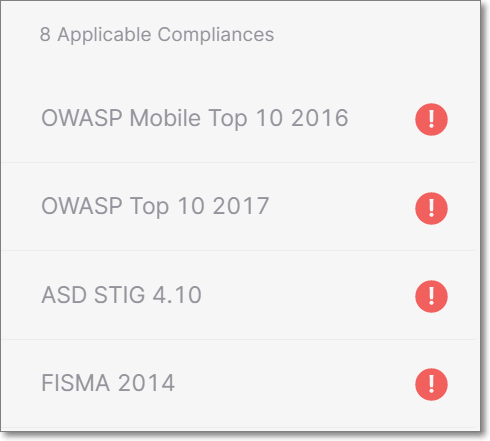
The Compliance tab shows details about applicable compliance standards for the Project. The left side panel shows a list of applicable compliance standards. Clicking on a standard shows info for that standard in the main display.
Caution
By default, results are shown for all supported compliance standards. It is possible to configure your account to show results only for specific compliance standards that are relevant for your organization. This can be set via the Scan Configuration API.
List Pane
The left side pane shows a list of all standards that are applicable for this Project (i.e. all standards for which the relevant queries were run).
Next to each compliance standard is either a checkmark, indicating that the Project passed the requirements of that compliance standard, or an exclamation point, indicating that it failed.
Notice
The Project is considered to have passed a compliance standard if it does not have any Critical, High, Medium, or Low severity vulnerabilities.
 |
Main Display
The main display show shows details about the vulnerabilities that were identified that do not comply with selected standard.
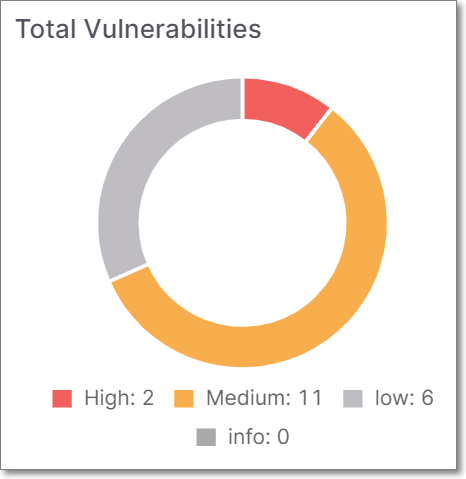
Total Vulnerabilities Widget
This widget shows the number of vulnerabilities that do not comply with this standard, broken down by severity level (Critical, High, Medium, Low, Info). The info is shown as color coded doughnut graph.
 |
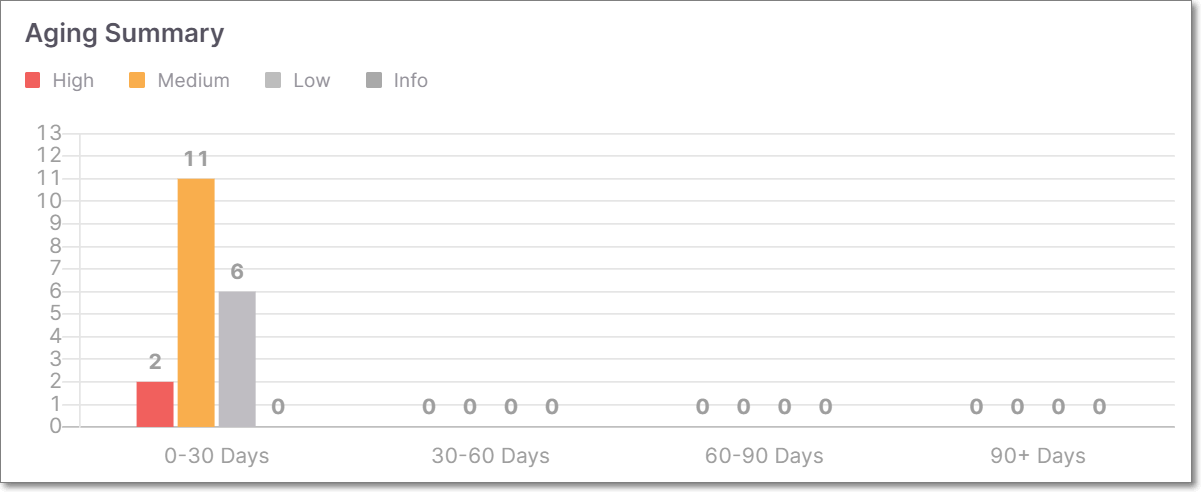
Aging Summary Widget
This widget shows a bar graph indicating the number of new vulnerabilities related to this compliance standard that were identified during various time periods. The data is broken down by severity level.
Note
The data shown in this widget is for vulnerabilities that are present in the last scan of the selected branch of this Project.
 |
Vulnerabilities Categories Table
The bottom section shows a list of categories of vulnerabilities that were discovered in the Project. For each category, details are shown about the vulnerabilities discovered.
The following information is shown for each category:
Parameter | Description | Possible Values |
|---|---|---|
Category | The name of the vulnerability category | e.g. Heap_Inspection, Privacy_Violation, etc. |
Total Vulnerabilities | The total number of vulnerabilities discovered in this category | A number |
Severity | The number of vulnerabilities, distributed by severity: Critical, High, Medium, Low, Info | A number |
Languages | The language(s) of the detected vulnerabilities | e.g. Java |
Engines | The type of scan engine that discovered the vulnerability | SAST, SCA or KICS |


