- Checkmarx Documentation
- Checkmarx One
- Checkmarx One User Guide
- Checkmarx One Reports
- Project Reports
- Viewing Project Reports
Viewing Project Reports
This report provides the details of the project once the report is generated.
 |
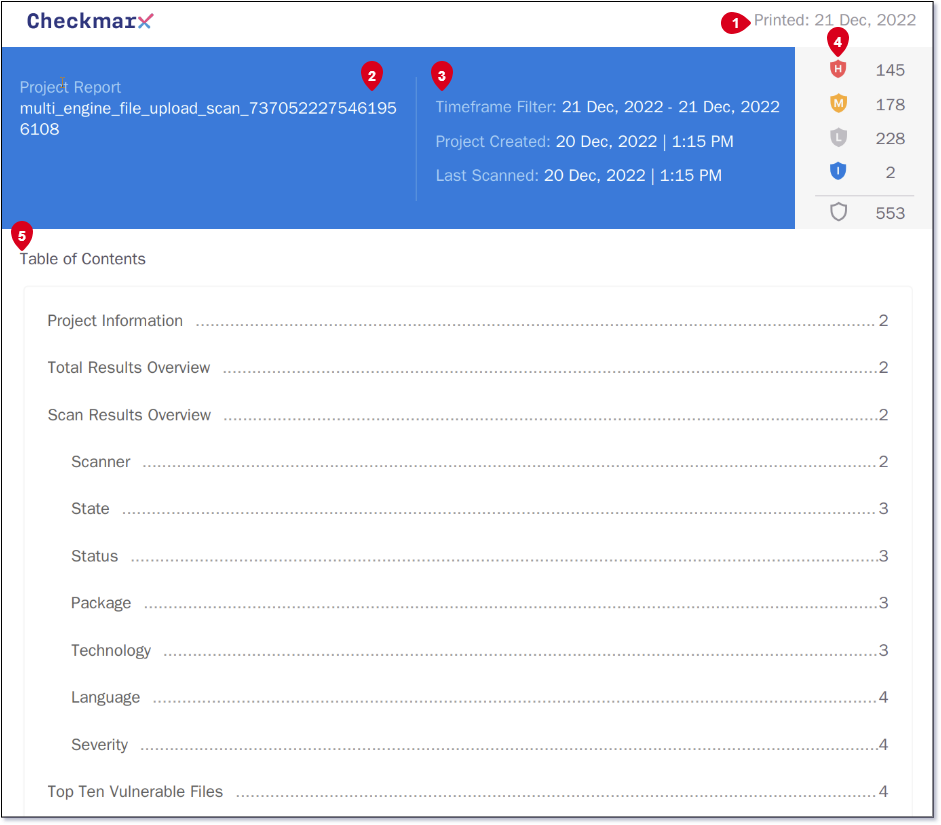
The first section of the Project Report shows the date when the report was generated (1).
In the table, the name of the project that the report was generated from is shown under Project Report (2). The Timeframe Filter shows the option that was selected from the Generate Report window, in the example above, it is from the current date to one month previously.
The date and time that the project was created and the date and time of when the project was last scanned is included (3).
The total number of risks is broken down into Critical, High, Medium, Low and Information (4).
The Table of Contents summarizes what sections have been included in the report with a hyperlink to the information (5).

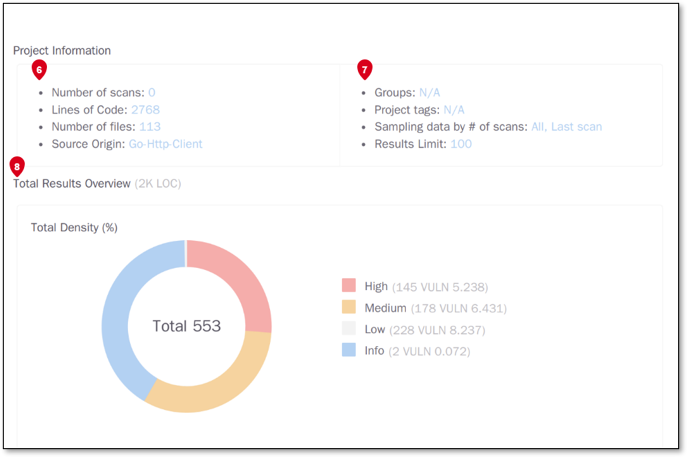
Project Information displays how many scans were run for this project including the number of lines of code and the amount of files that were scanned. The source origin of the project can include a repository or a web portal. A zip file does not display a source origin (6).
This section also Includes the groups assigned to the project. Any tags and custom tags that have been applied to the project are included. The sampling data by number of scans indicates all data that has been included to present the information in the report below. The results limit is the limit that was set when generating the report (7).
Total Results Overview includes the Total Density which provides the percentage of the level of vulnerabilities found, for example, High, Medium, Low and Info (8).

Scan Results Overview is the section that follows. This includes the percentage of the vulnerabilities found by SAST, KICS and SCA. The pie charts presented in the report are the following:
By State - The states include urgent, confirmed, to verify, PNE and not exploitable.
By Status - Shows the vulnerabilities that are new, recurrent or fixed.
By Package - Is only applied to SCA. If SCA is not included in the report a No Data Found message will appear in this section.
By Technology - Presents the top 6 most vulnerable files which includes SAST, KICS and SCA.
By Language -Shows the language that is the most vulnerable, for example, Java.
By Severity - Indicates the severity of the level of the vulnerability, for example, high, medium, low and info.
Top 10 Vulnerable Files - These top 10 files include all files and are not only limited to technology as the ones in By Technology are.
The following section shows the information, in a time spectrum chart format and provides the following information:
Resolved Vulnerabilities By Severity - Shows how many results from a high medium low or info level were resolved.
Resolved Vulnerabilities By Scanner - Shows how many vulnerabilities were resolved for SAST, KICs and SCA
Results Total Combined - Combines the results for all the different file types.
Results By Scanner - Shows the results by the SAST, KICS and SCA scanner this indicates which scanner produced the most results. When this chart shows a degradation curve, it indicates that no scans were produced or scans were produced but some of them were fixed and were reintroduced causing the curve to grow.
Note
Project Reports cannot be downloaded directly from the site.