- Checkmarx Documentation
- Checkmarx Codebashing
- Managing Codebashing as an Administrator
- The Administration Dashboard
The Administration Dashboard
The Administration Dashboard serves as Codebashing’s landing page. It contains information and graphical elements that summarize and illustrate the status of your teams and their training progress. For more information on a graphical element hover your mouse over it and a tip with additional information will appear.
From the menu, select Dashboard.
At the top of the dashboard is the general information:
Active Users: Displays the number of available licenses versus the number of active licenses. For example, 42/1001 means that your license agreement includes 1001 licenses and 42 of them are active.
Subscription Ends: The date on which the license expires.
You may filter and customize the display:
Click DISPLAY BY: ALL USERS to open the filter options. By default, no filter is active and the charts in the Administration Dashboard apply to all active users.
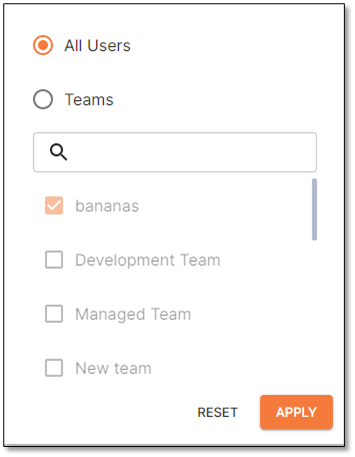
Select Teams. The list of teams becomes available for editing.
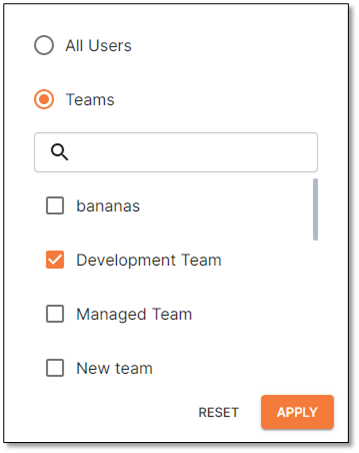
Select the desired teams from the list and click <Apply>. The DISPLAY BY link now reads DISPLAY BY:TEAMS (#) to indicate that only the properties for specific teams are displayed with the number of the teams selected (#). The following sections of the Administration Dashboard are affected:
User Completion Rate
Top 5 Courses
Lesson Enrollment
The table below lists and illustrates the User Completion Rate graphs and their elements.

Element | Description |
|---|---|
Overall Completion (primary and assigned) | The progress on the primary courses and all the lessons assigned to users. In this example, the progress of all licensed users:
|
Primary Courses | The progress on the primary courses assigned to the users:
|
Assigned Lessons | The progress on the lessons assigned to the respective users. Note: This graph does not reflect the progress on the primary course:
|
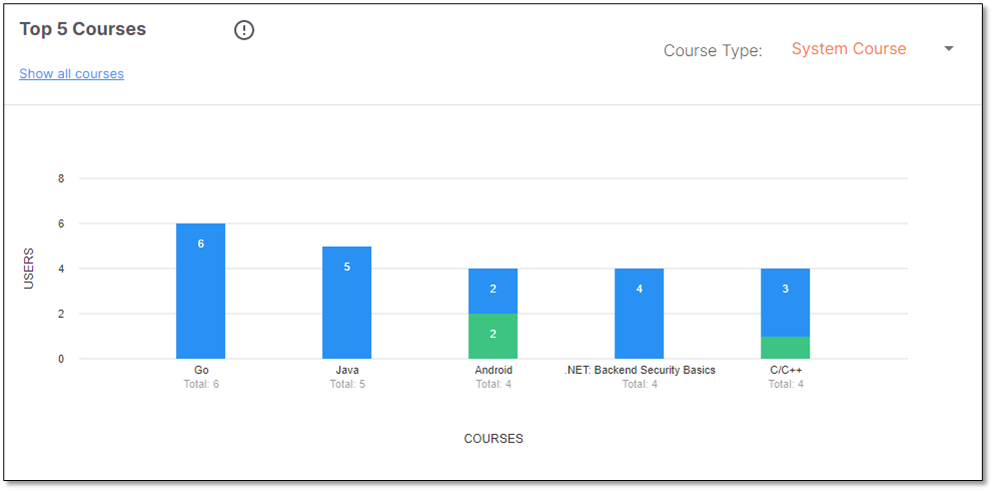
The graph below indicates the popularity of courses by illustrating the 5 most popular courses:
The bar diagram below shows users who have started or completed the respective course. Users who did not start the respective course do not appear.
The number of all users who are currently taking the respective course is indicated in blue. This includes users who have this course assigned to them as a primary course and others who take this course as, a non-primary course.
In the example below, 6 users are taking the Go course, regardless of whether it was assigned to them as a primary course or not.
The number of all users who completed the respective course is indicated in green.
In the example below, 2 users completed the Android course and 1 user completed the C/C++ course.
To customize the displayed courses:
To display cumulative progress on all courses, follow the Show all courses link or select Course Progress from the menu.
To only display the courses provided with Codebashing, click Display By: and select System Course from the menu.
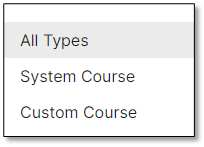
To only display courses created by an admin user, click Display By: and select Custom Course from the menu.
To return to displaying all courses, click Display By: and select All Types from the menu.
The graph below illustrates the lessons' enrollment status.
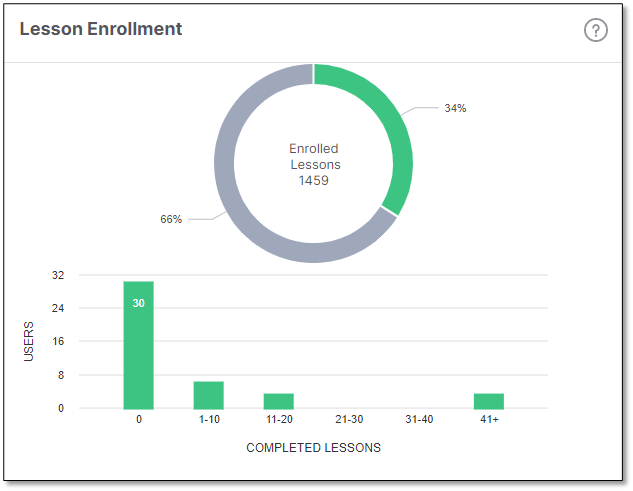
Enrolled Lessons refers to the total number of primary and assigned lessons of all users.
66% of the assigned lessons have not been started by any user.
34% of the lessons have been completed by any user. This includes the users who had these lessons assigned to them and those who took them without being assigned to them.
The bar diagram divides the users into groups according to the number of lessons they completed. In this example, they are as follows:
30 users completed 0 lessons.
6 users completed 1-10 lessons.
3 users completed 11-20 lessons.
0 users completed 21-30 lessons.
0 users completed 31-40 lessons.
3 users completed more than 41 lessons.
The leaderboard lists the rank and scores of the top five teams and individual users. To view the rank and scores of lower-ranking teams or users, click the relevant arrow at the bottom.
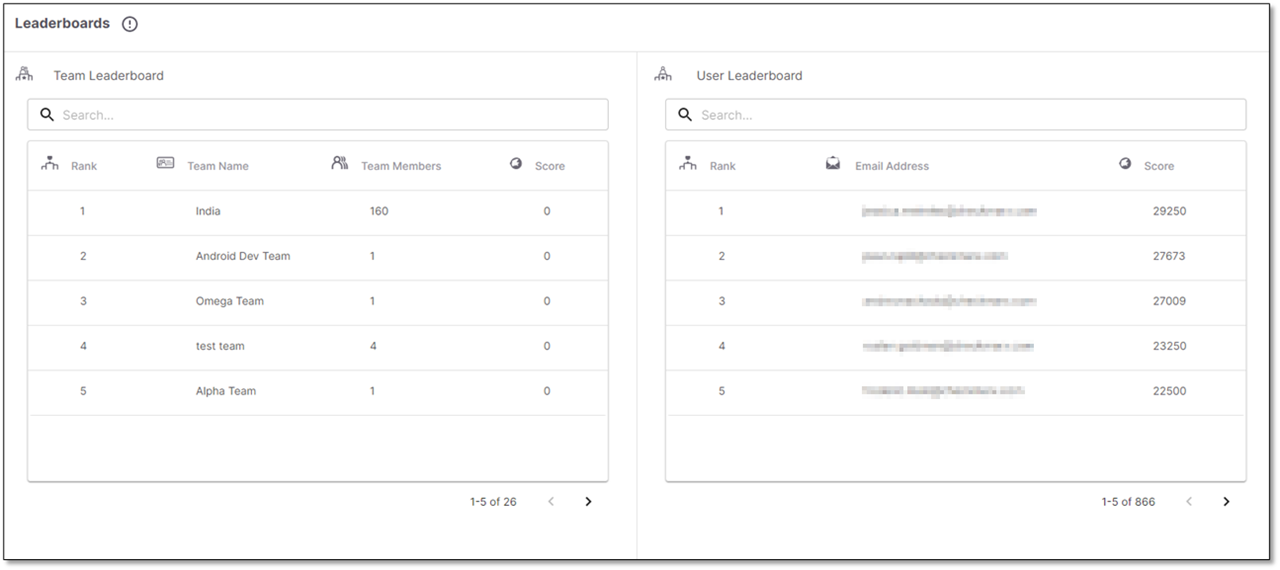
The graph below displays a summary of the latest assessments.
To open the full Assessment Dashboard, click Show All Assessments or select Assessments from the menu.

Item | Description |
|---|---|
Assessment Name | The name assigned to the assessment when it was created. |
Timeframe | The time range during which the assessment has to be taken. The time frame is defined by the admin user when creating the assessment. |
Topics | Displays the included assessment topics for the selected preset. For a list of presets, assessment topics, and associated vulnerabilities, refer to To view and understand available assessment presets for creating assessments in Managing Assessments. |
Users Assessed | Lists how many users have been assessed out of the total number to whom the assessment was assigned, for example, 2/5 means that 2 users out of 5 have been assessed. |
Rating | Displays the overall rating of all assessed users of a specific assessment. For additional information, refer to To view an existing assessment in detail in Managing Assessments. |
The graph below summarizes the latest tournaments.
To open the full Tournaments Dashboard, click Show All Tournaments or select Tournaments from the menu.
For further information and instructions on tournaments, refer to Managing Tournaments.

Item | Description |
|---|---|
Tournament Name | The name assigned to the tournament when it was created. |
Date | The date when the tournament took place. |
Rounds | The number of rounds in the tournament. |
Participants | The number of participants in the tournament. |
Rating | The performance rating of the team during the tournament. |