Understanding Eclipse Scan Results
When you view scan results in Eclipse, CxSAST provides an interactive interface for navigating the results:
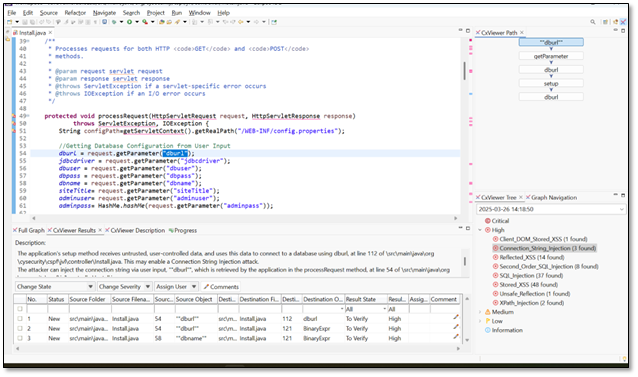
In addition to the regular Eclipse code pane (default position: upper-left), the CxViewer interface includes four panes with different levels of information:
CxViewer Tree (default position: lower-right): Lists all vulnerability types in a navigation tree according to Severity (High / Medium / Low / Information).
CxViewer Results : A tabular list displaying details of found instances, including the vulnerability short description. Select an instance to highlight it in the graphs (Full Graph and Graph Navigation; see below) and view it in the CxViewer Path (see below).
CxViewer Description: Displays comprehensive information about this vulnerability type, including risk details, a description of the cause and mechanism, recommendations for avoiding the vulnerability and source code examples.
Clicking (
 ) takes you to Codebashing, our interactive learning platform, where you can learn about code vulnerabilities, why they happen, and how to eliminate them. Once there, select a tutorial and start sharpening your skills.
Notice
Codebashing™
CxSAST users can have free access to a limited set of Codebashing lessons.
Available free lessons are: SQL Injection (SQLi), Cross-site scripting (XSS), XML Injection (XXE). The free lessons are available for the following programming languages: Java, .Net, PHP, Node.JS, Ruby, Python
The full (paid) version will include over 150+ individual lessons across many common web, mobile and embedded programming languages. Please refer to Codebashing for a full list of supported programming languages and lessons.
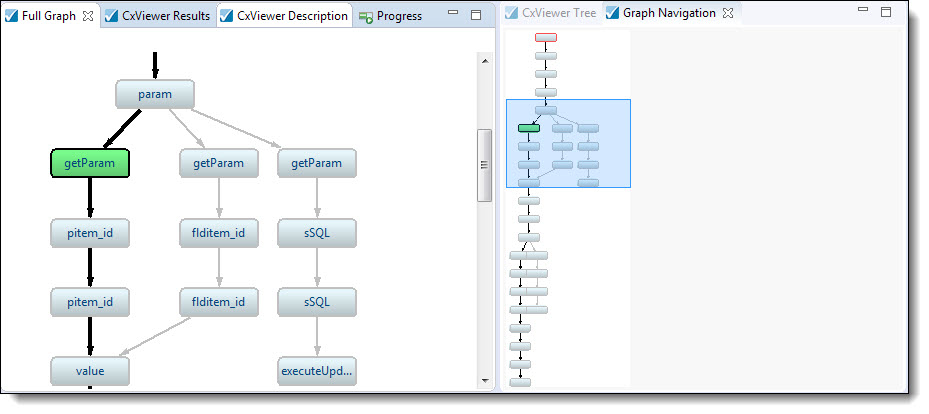
Full Graph (default position: lower-left): Graphical display of full paths of all found instances of the vulnerability type selected in the CxViewer Tree. Graphical intersections represent the relationships between the instances. The instance selected in the CxViewer Results is emphasized in the Graph (bold arrows), and one of its elements is highlighted (bold border, green fill).
The red-bordered element represents a best-fix location: securing the code at this point will fix multiple instances of the vulnerability.
If the Graph is large, only part of it may be visible. You can move to other parts with the scroll bar or Graph Navigation (below).
You can drag elements to re-arrange the graph. Element connections are maintained.
Select an element in the Full Graph to view and select this code in the context in the file's source code above. This also causes the instance where the element is displayed in the Full Path pane.
Graph Navigation (default position: tab in the lower-right pane): The same content as the Full Graph, zoomed out so that the entire graph is visible. Drag the blue rectangle to set the focus for the Full Graph:
Full Path (default position: upper-right): The full path of code elements that constitute the vulnerability instance that is selected in the CxViewer Tree and in the Full Graph. This path represents the full attack vector for the vulnerability instance.
Select a code element in the Full Path to view and select it in the file's source code.