- Checkmarx Documentation
- Checkmarx SAST
- SAST User Guide
- Working with Logs
- Analyzing Logs Using ELK
Analyzing Logs Using ELK
Scan logs are downloaded as zip archives for viewing and further treatment in the previously illustrated format.
The Log Structures
The table below compares a typical line of a log in plain text format with a line from a log in the new JSON format.
Log Format | A Typical Line |
|---|---|
Legacy | 2020-11-12 11:25:25,968 [38] ERROR - Failed to fetch engine server information with server id 1 reason:Operation returned an invalid status code 'Unauthorized' |
JSON | {"Timestamp":"2020-12-23 09:25:09,251","GUID":"de73292e-1558-4454-8013-3a79d27ca102","Service":"ScansManager","ThreadId":24,"Level":"INFO","Correlation":{"ScanRequest":"1000004","Project":"4","Scan":"645cd5cf-6e89-4405-97b5-267029f54b2b" },"CallerInfo":{"Line":501,"Class":"C:\\CxCode\\CxApplication\\Source\\Common\\CxDAL\\ScanRequests\\ScanRequestDataProvider.cs","Method":"ExecuteUpdate" },"Message":"Tried to update ScanRequest id: 1000004. Sucess? True"} |
Notice
To analyze logs using ELK, you have to use the JSON format of the respective log.
The log is available in JSON format along with the plain text format or instead of it, depending on the enabled log format.
The Log Structure of the Log in JSON Format
Every line in the log consists of the following types of information as illustrated and explained for the log line below:
{"Timestamp":"2020-12-23 09:25:09,251","GUID":"de73292e-1558-4454-8013-3a79d27ca102","Service":"ScansManager","ThreadId":24,"Level":"INFO", "Correlation":{"ScanRequest":"1000004","Project":"4","Scan":"645cd5cf-6e89-4405-97b5-267029f54b2b"} ,{"Line":501,"Class":"C:\\CxCode\\CxApplication\\Source\\Common\\CxDAL\\ScanRequests\\ScanRequestDataProvider.cs","Method":"ExecuteUpdate"},"Message":"Tried to update ScanRequest id: 1000004. Sucess? True"}
The same log, color-coded according to the colors in the Log_line:
 |
 |
Timestamp: Timestamp for each log line entry.
GUID: Unique identifier, which allows you to view all logs related to a specific component/service.
Service: Component identifier, this can be customized in the config file, by default it is the name of the component, e.g., JobsManager
ThreadId: Thread/process identifier.
Level: Logs with different severities can be logged at different levels. The visibility can be limited to a single level, displaying only logs at a certain severity or above, for example only logs of ERROR.
CorrelationID: Provides the ability to correlate logs in a certain flow/request. Being able to see all the logs relevant to a particular request or a particular event, helps you to drill down to the relevant information for a specific request. (e.g.,: ScanId, is the same across several services)
Correlation: Provides the ability to correlate logs in a certain flow/request. Being able to see all the logs relevant to a particular request or a particular event helps you to drill down to the relevant information for a specific request. (e.g.,: ScanId, is the same across several services). Please note that Correlation is an attribute that aggregates relevant properties such as ScanRequest, Project, ScanId, etc.
Line: Number with lines of code where the log entry is. The scheme refers to it as LoC.
Class: Class name where the log entry is.
Method: Method name where the log entry is.
Message: A free text string with contextual information.
Analyzing Logs
ELK stands for the combined use of three open source projects, Elastic Search, LogStash and Kibana. They work together as follows:
E: Stands for Elastic Search and is used for storing logs.
L: Stands for LogStash and is used for both shipping as well as processing and storing logs.
K: Stands for Kibana, which is a web-based visualization tool hosted by Nginx or Apache.
ELK provides centralized logging that can be useful when attempting to identify problems with servers or applications. It allows you to search all your logs in a single place. It also helps to identify issues in multiple servers by connecting the respective server logs during a specific time frame.`
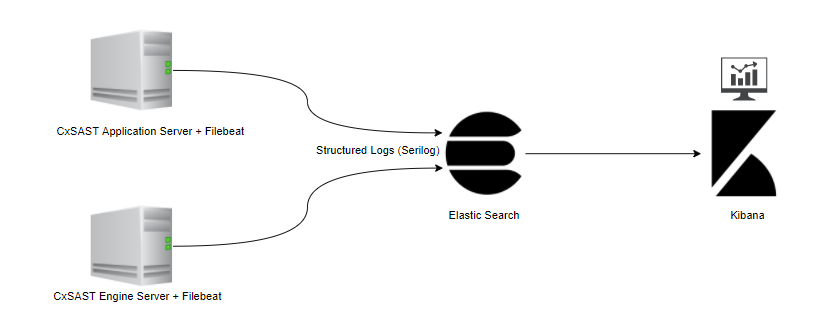
The ELK components are used as illustrated in the simple diagram below:
 |
The components are the following:
Logs: Server logs in JSON format that are subject to be analyzed. These logs are generated together with the legacy logs and reside in the separate JSON folder.
Beats: For example Filebeat: It is responsible for collecting log data and forwarding it to the Logstash or directly to Elastic Search.
Logstash: Parses and transforms data received from the beats (for example Filebeat).
Elastic Search: Indexes and stores the data received from the beats or Logstash.
Kibana: Uses the Elasticsearch database to explore, visualize and share the log data.
To simplify the system, the Checkmarx ELK system does not use the Logstash and forwards data directly to the Elasic Search as illustrated below.
 |
The ELK Components Used To Analyze CxSAST Logs
Checkmarx uses and supports Filebeat, Elastic Search and Kibana. The components are located as follows:
Filebeat on the host that hosts your CxSAST Engine server or the CxSAST application server. For further information and instructions, refer to Getting Started with Filebeat.
Elastic Search on a dedicated server. For further information and instructions, refer to the Elastic Search installation instructions.
Kibana on a dedicated server. For further information and instructions, refer to the Kibana installation instructions.
Analyzing a Log
To analyze a log, you have to enter your Kibana space via the Kibana interface that you created while installing Kibana.
To enter the Kibana space:
Open your Internet browser and enter the URL of your Kibana space, which is something like http://{FQDN or IP}/{folder}/kibana#/home, for example https://cx-kibana.dm.cx/s/cxsast/app/kibana#/home?_g=().
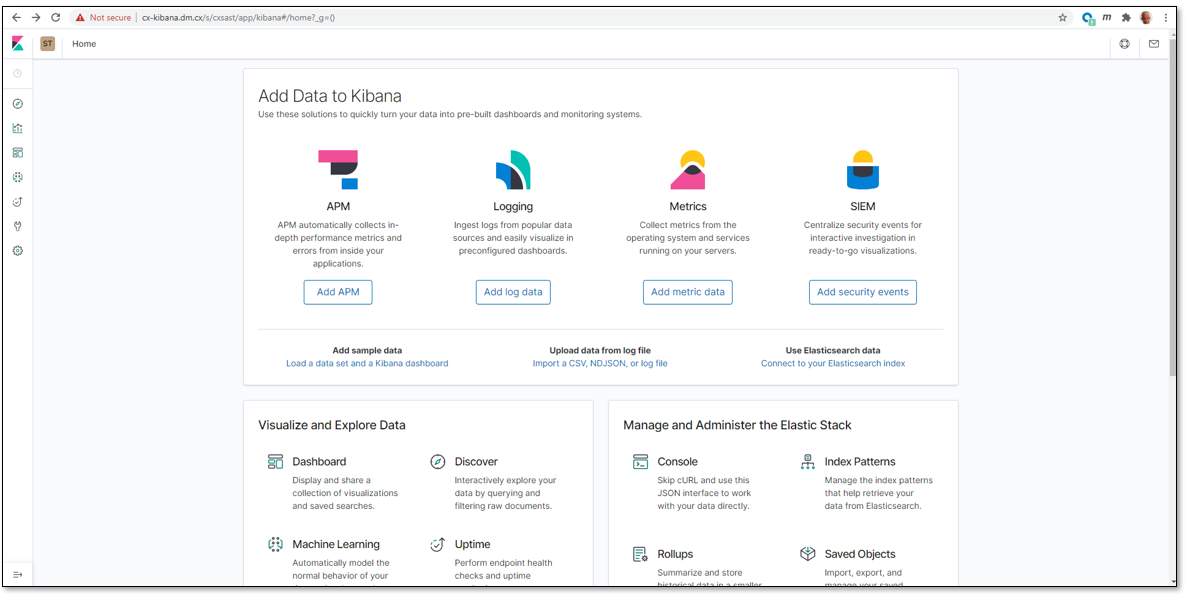
Click <Add Log Data> to import a scan log.
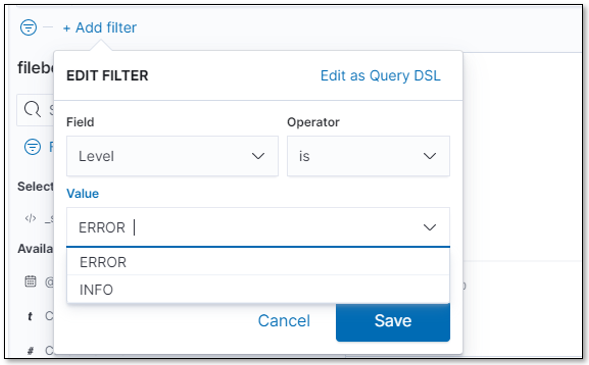
Filter the log for Level ERROR as illustrated below.
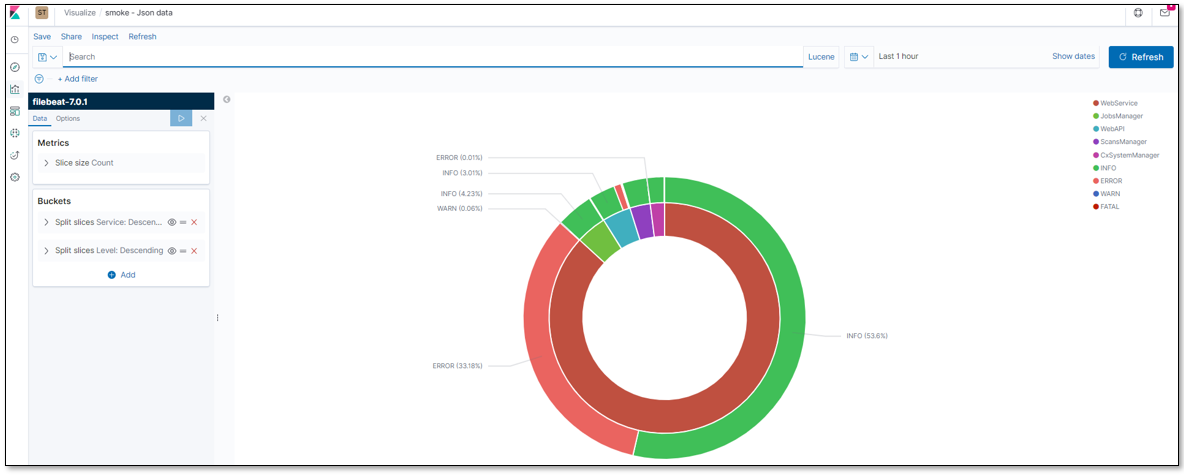
The results are displayed as follows:
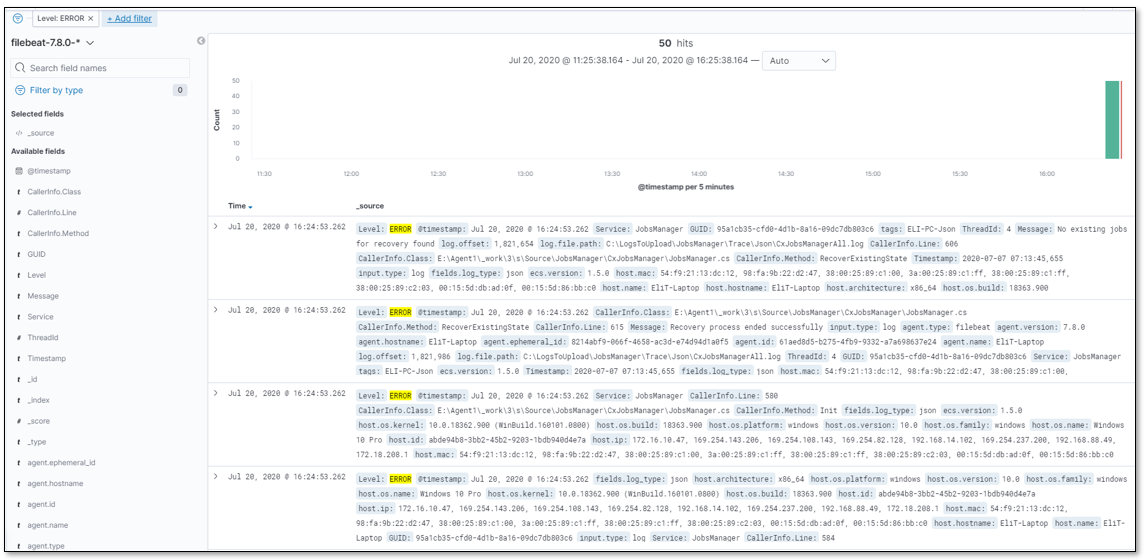
Follow the onscreen instructions and options to continue illustrating the log results.
