Using the Checkmarx One JetBrains Plugin
Once you have run a Checkmarx One scan on the source code of your JetBrains project, you can import the scan results into your JetBrains IDE. The results are integrated within the IDE in a manner that makes it easy to identify the vulnerable code triage the results and take the required remediation actions.
First you need to import the results from the latest scan of your JetBrains project. Then you can view the results in your JetBrains IDE.
Notice
Alternatively, you can run a new scan on an existing Checkmarx One project from your IDE and load the results.
Importing your Checkmarx One Scan Results
To import results from a scan:
In your JetBrains project, click on Checkmarx (on the bottom of the screen) to open the Checkmarx panel.
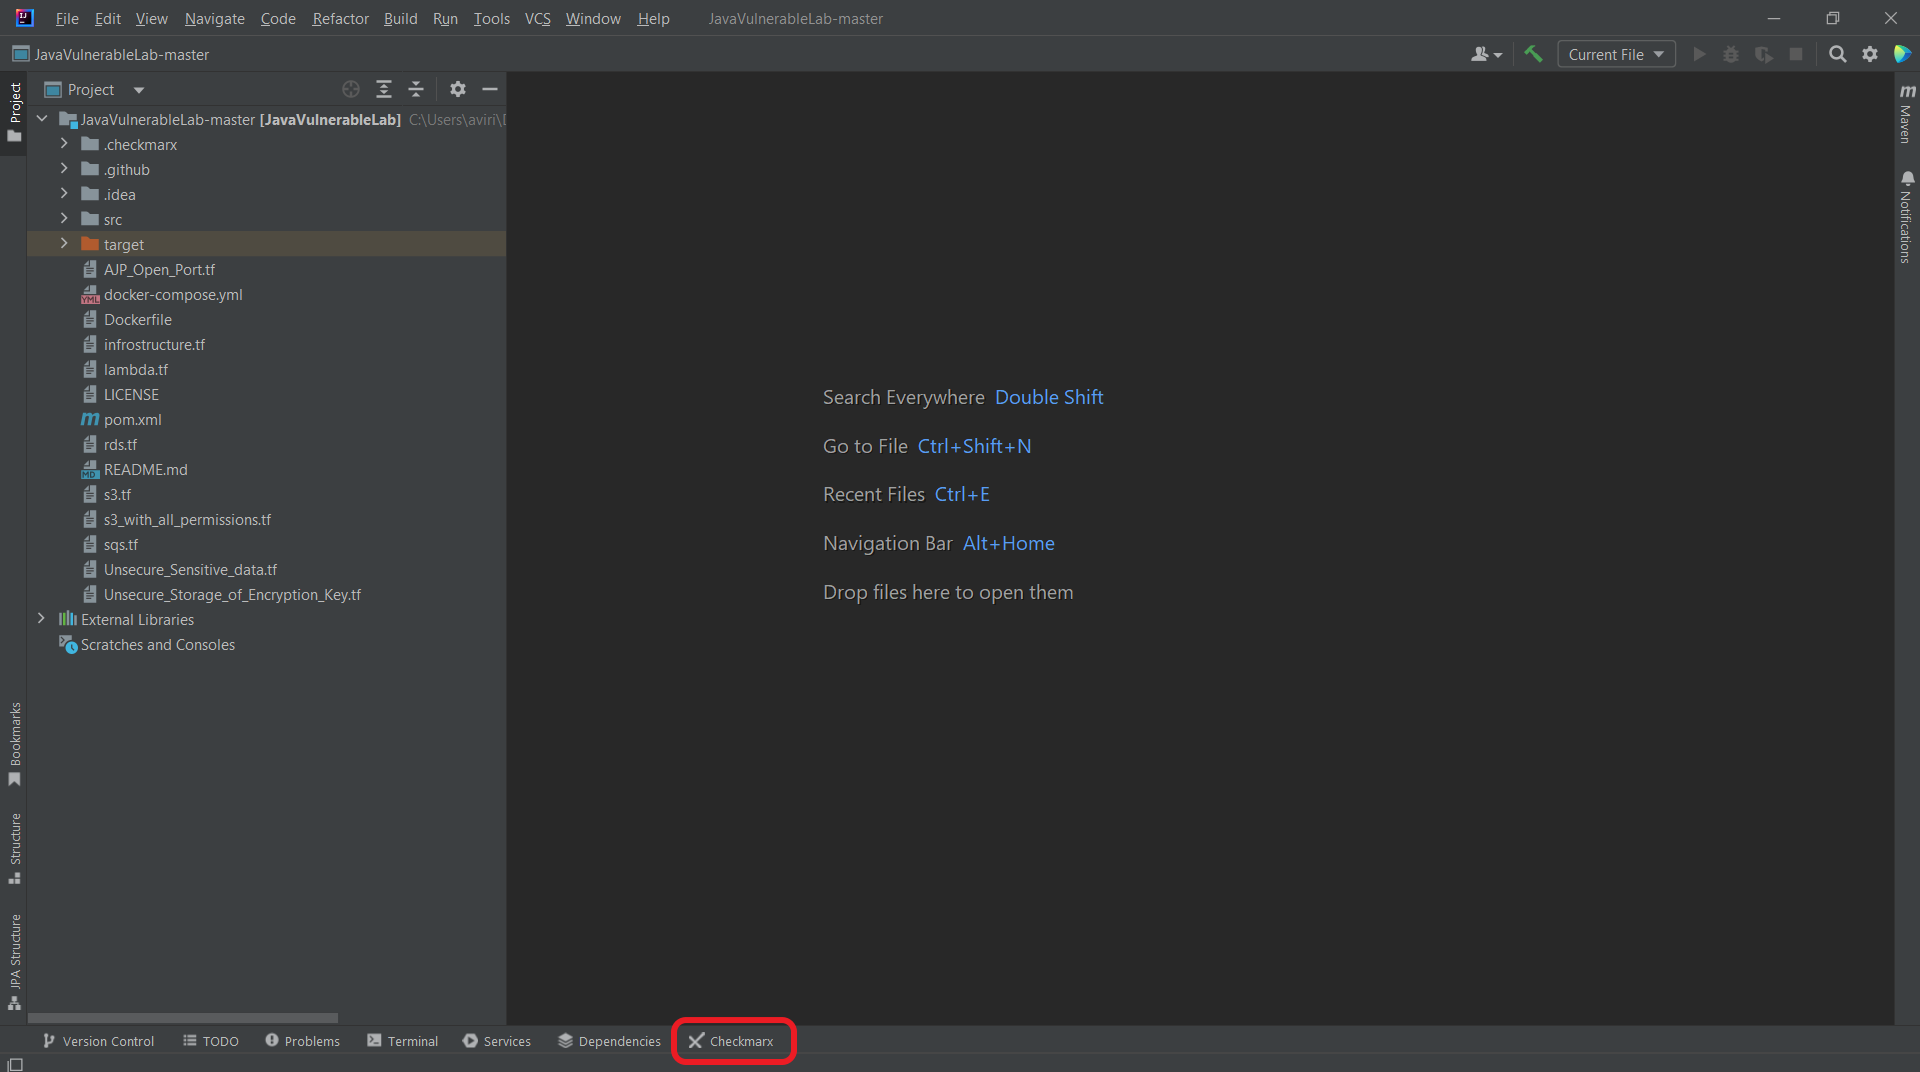
The Checkmarx panel opens on the bottom of the screen.
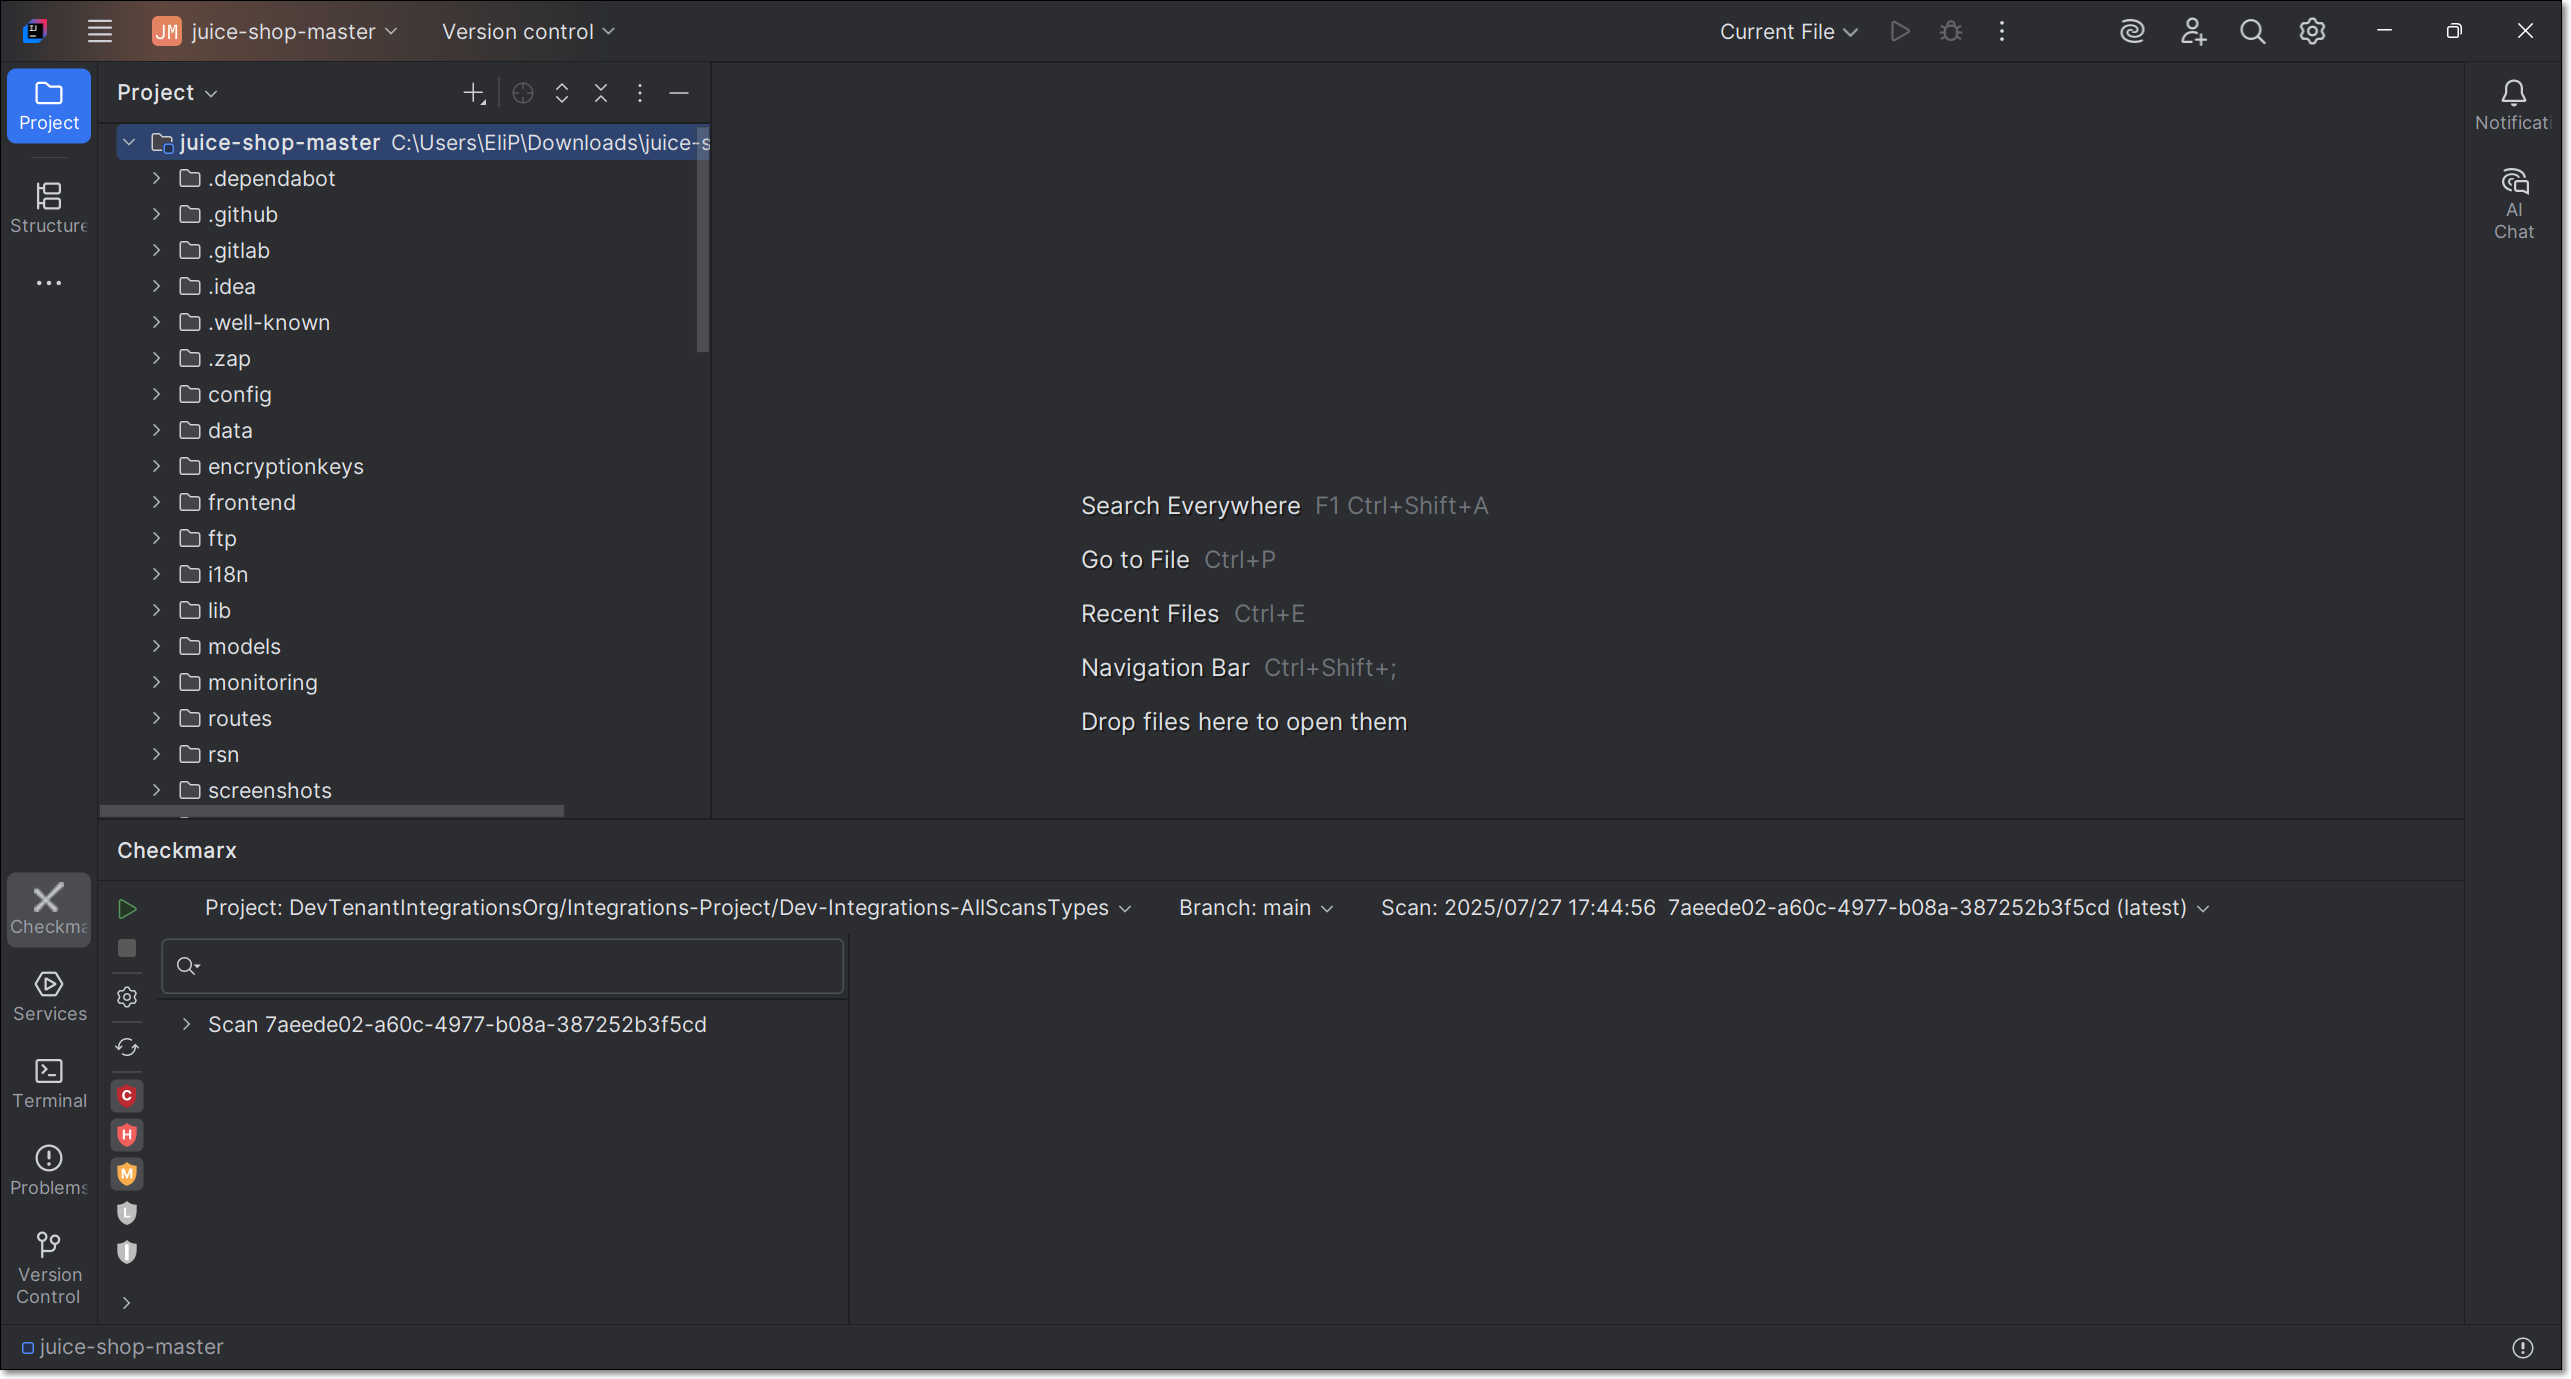
The plugin will try to automatically show results for the relevant scan by matching your project and VCS branch to an existing Checkmarx One scan.
If the desired scan is not displayed, you can select the scan manually by entering the Scan ID of the desired scan in the Scan field.
Use one of the following methods to submit the relevant Scan ID.
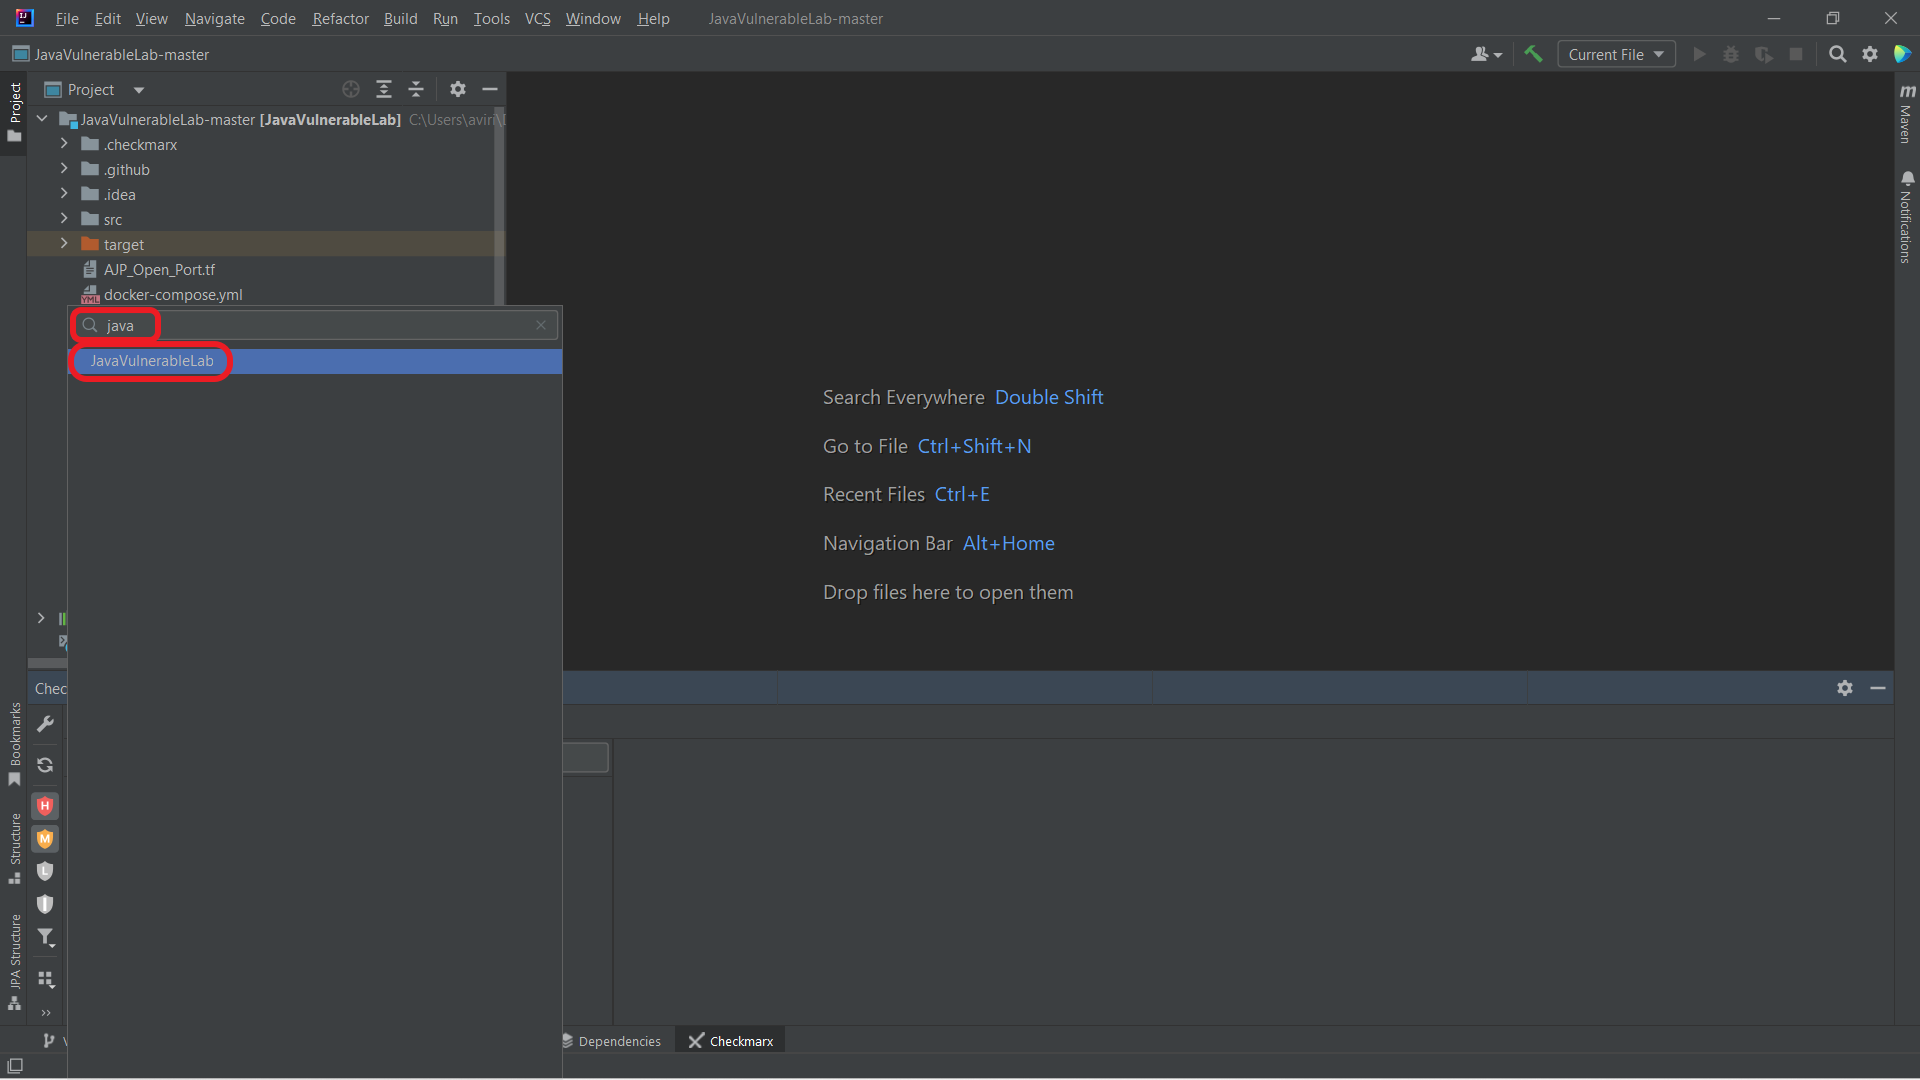
In the Checkmarx panel, click on the Project dropdown.
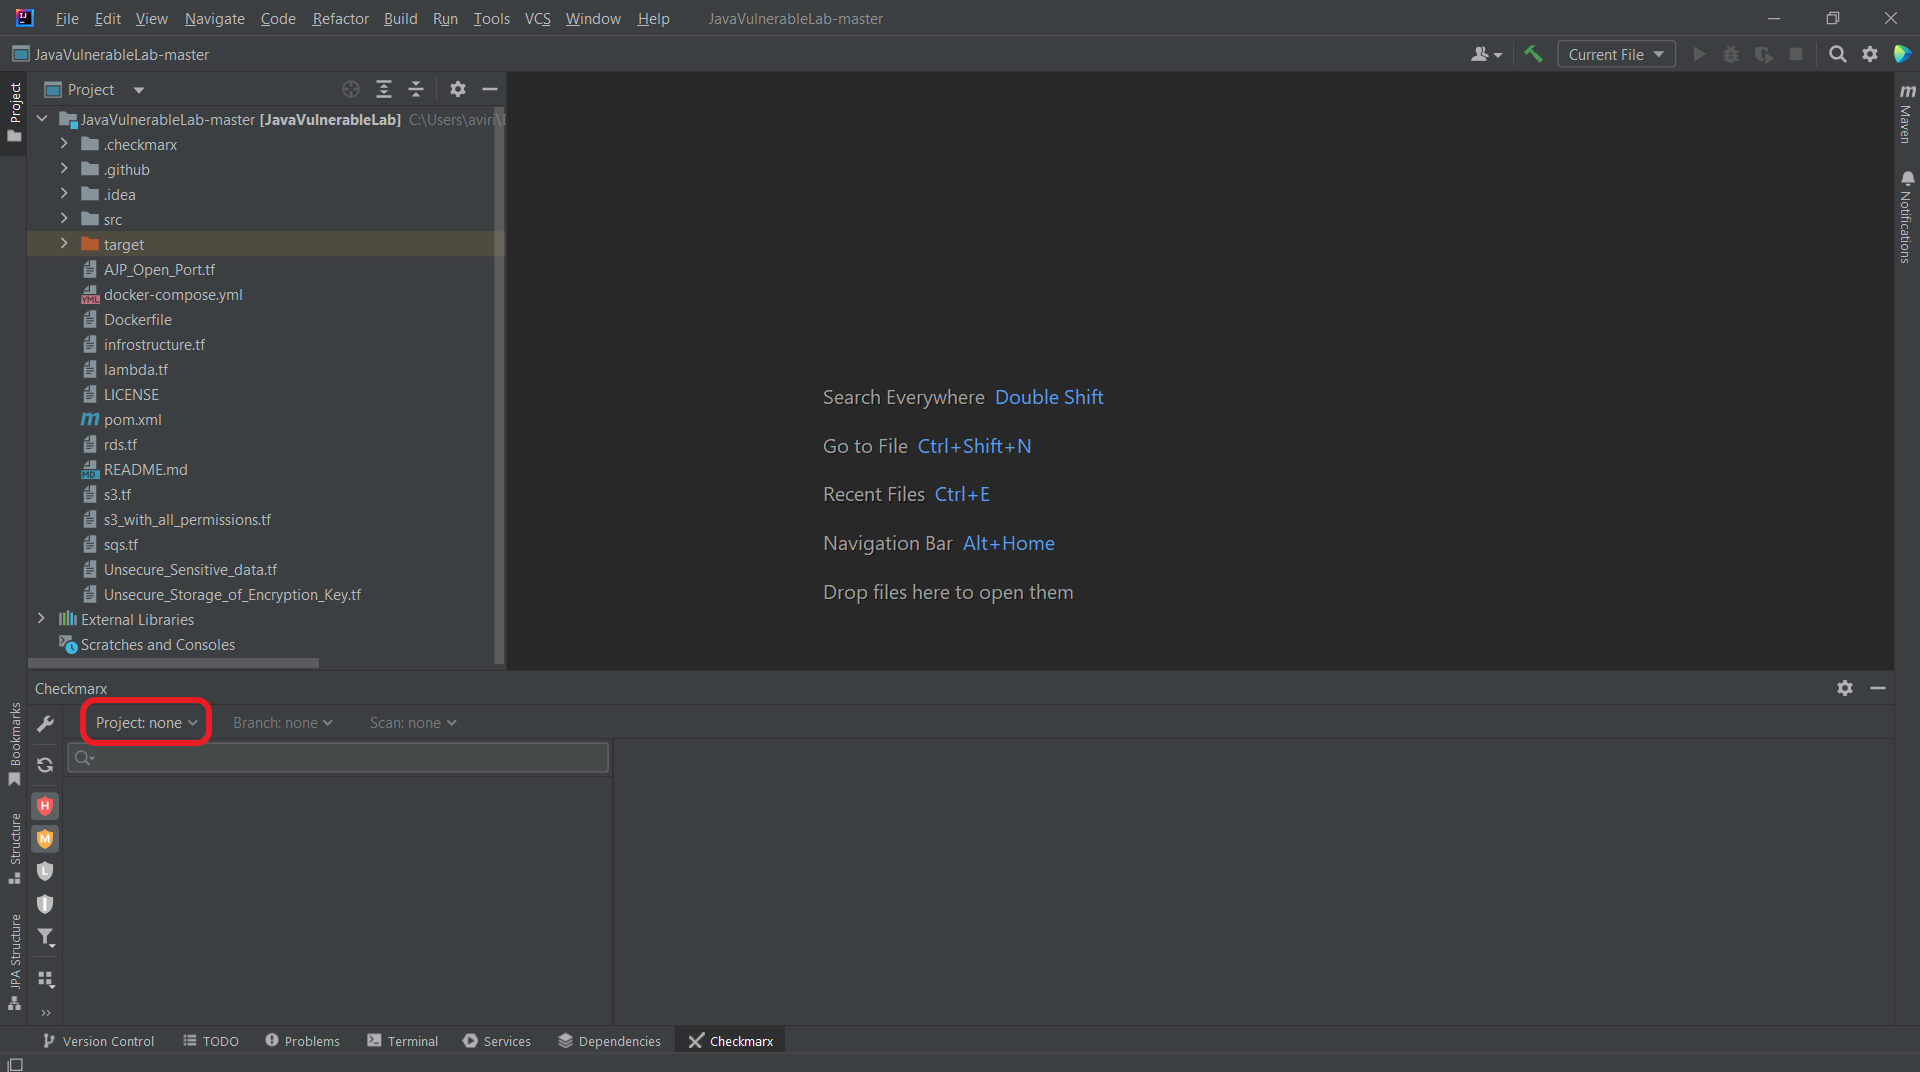
A dropdown list of your Checkmarx One Projects is shown.
Select the Checkmarx One Project that corresponds to the JetBrains project that you are working on.
Notice
You can filter the list by typing the name of the desired Project.
The Branch field automatically refreshes, and retrieves available branches for this Project.
Click on the Branch dropdown.
A dropdown list of the branches for the selected Project is shown.
Select the desired branch.
Notice
You can filter the list by typing the name of the desired branch.
The Scan field automatically refreshes, and retrieves available scans of this branch of the Project.
Click on the Scan dropdown.
All of the scans for this branch are shown, with the most recent on top.
Select the desired scan.
The scan results are imported into JetBrains and the selected scan ID is shown below the search box in the Checkmarx panel.
Warning
Only scans that completed successfully are shown in the IDE. Scans with only partial results aren't shown.
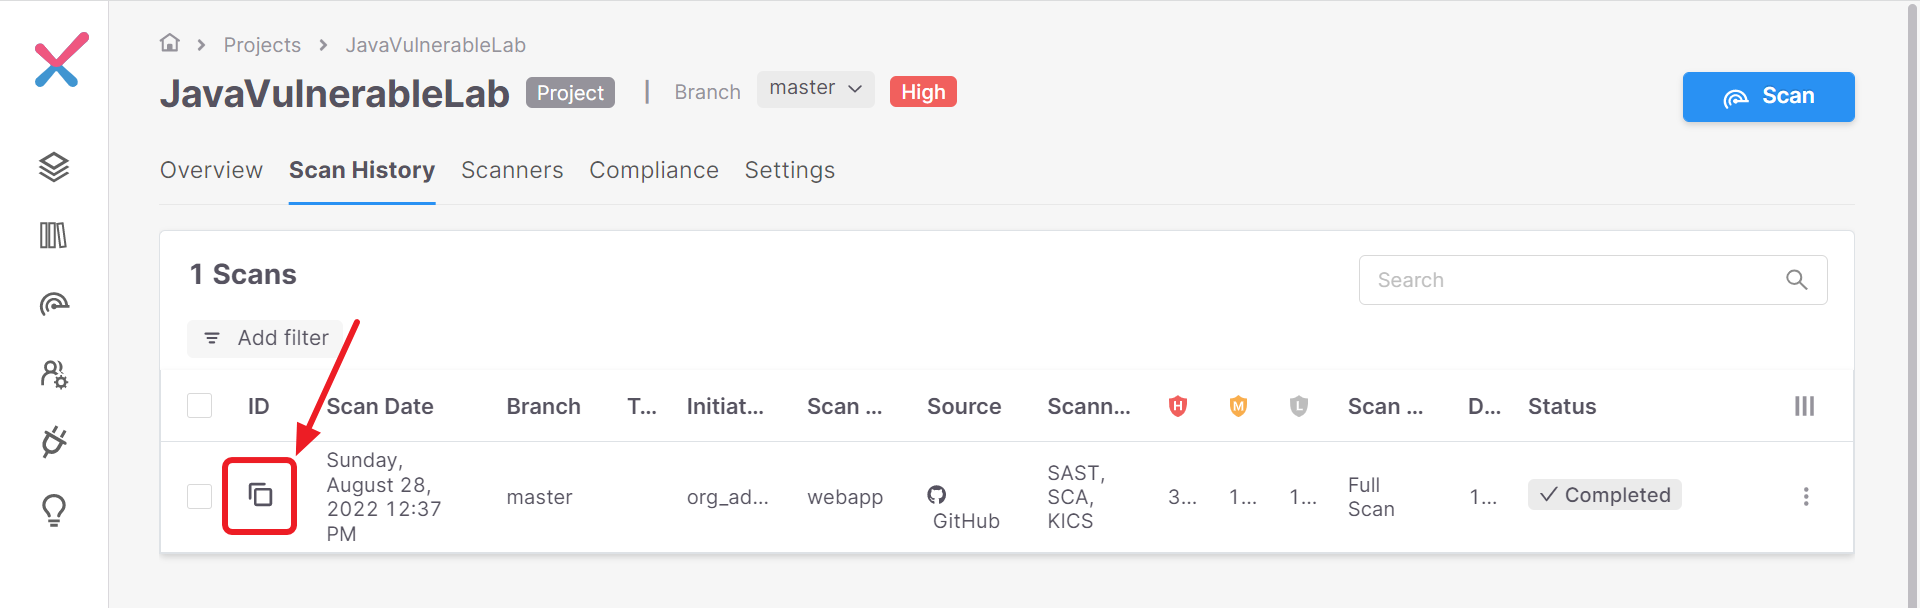
Log in to the Checkmarx One web application.
Navigate to the desired Project page.
On the Scan History tab, copy the Scan ID of the desired scan.
In the JetBrains console > Checkmarx tab, in the search box, paste the Scan ID and press Enter.
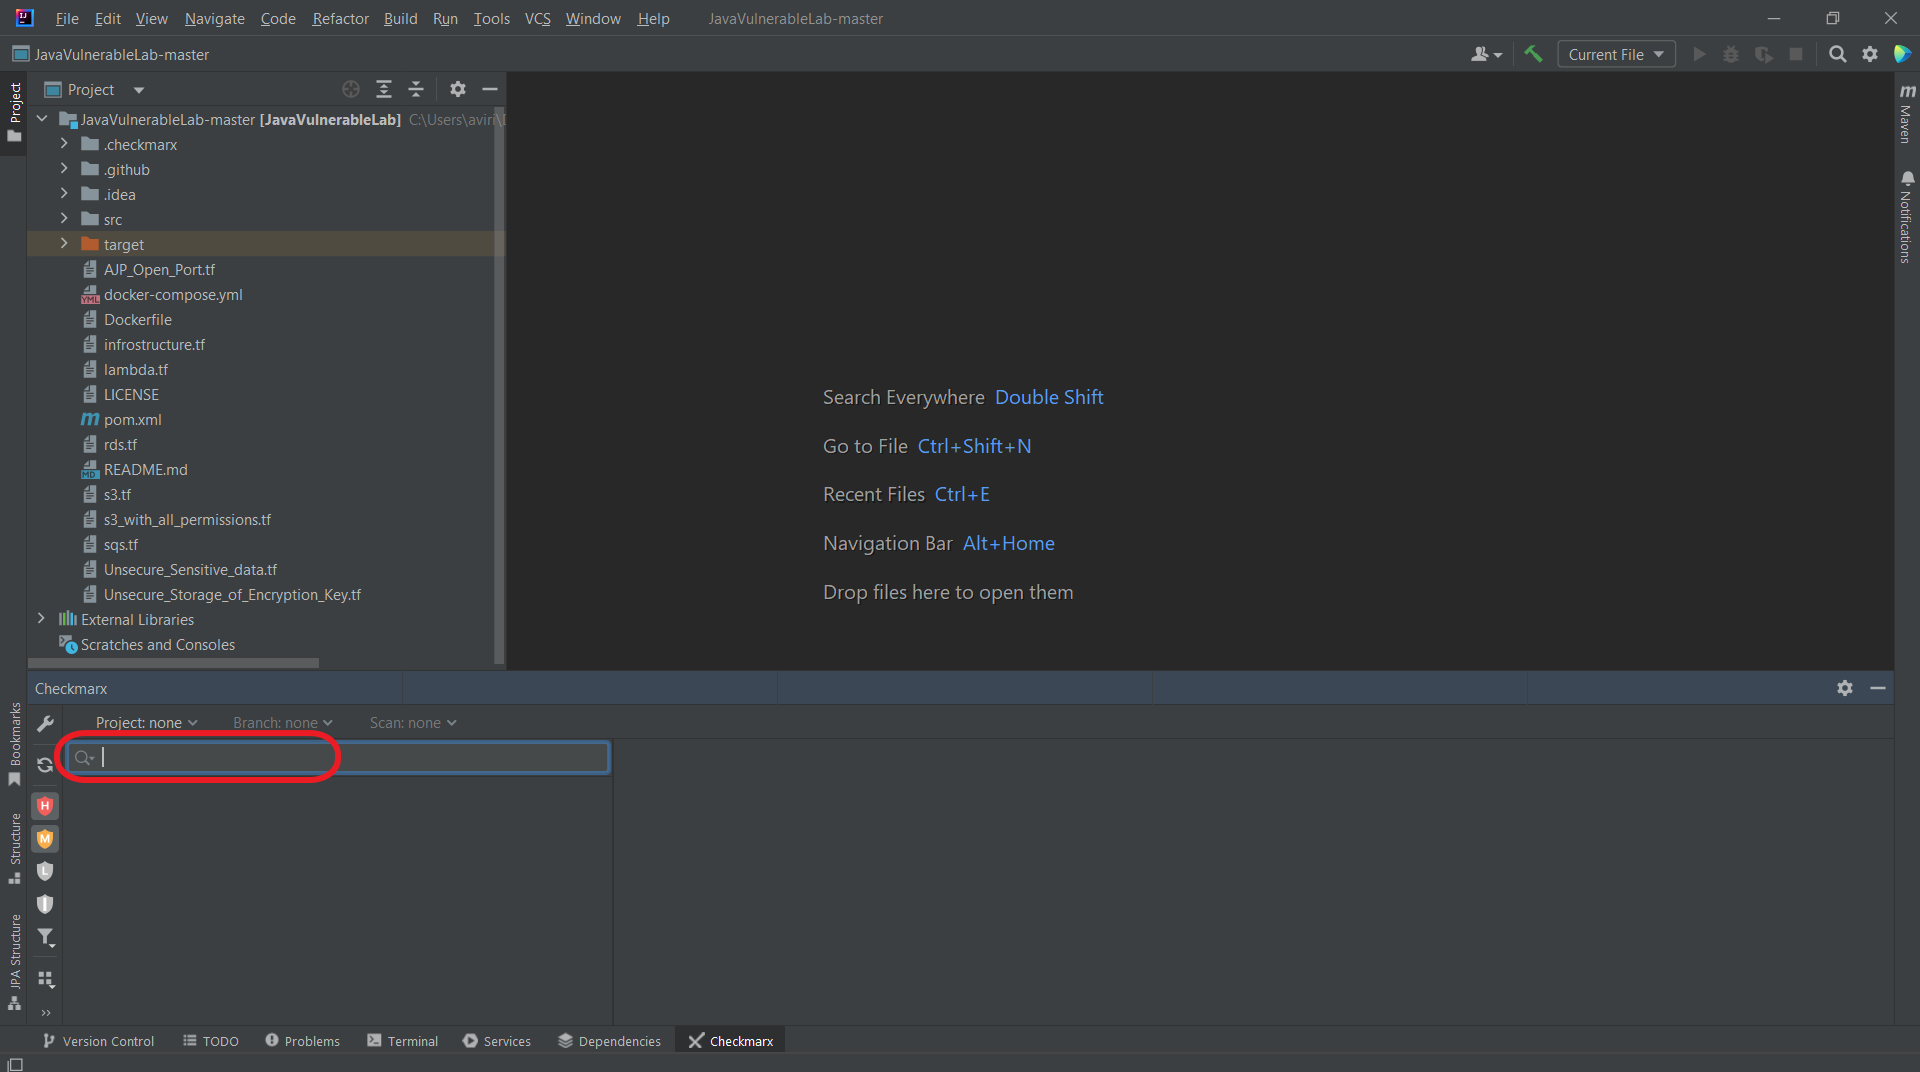
The scan results are imported into JetBrains and the selected scan ID is shown below the search box in the Checkmarx panel.
Running Scans from JetBrains
You can run a new Checkmarx One scan on the project that is open in your JetBrains workspace.
You must first create a Checkmarx project via the web portal (UI), API, CLI etc. Then, you are able to run scans on that project from the JetBrains console. You can choose either to rescan the same branch of the Checkmarx One project, or to create a new branch in Checkmarx One for the scan of the local branch in your workspace.
The IDE initiated scan applies the scan configuration that was used for the previous scan of this project branch. For example, if the last time you scanned this branch of the project you excluded certain files, those files will be excluded also from the current scan.
Notice
When a scan is initiated via the IDE, the SAST scanner runs an "Incremental" scan. Learn more about incremental scans here.
Warning
This feature needs to be enabled for your organization's account by a Checkmarx admin user under  Settings > Global Settings > Plugins in the Checkmarx One web portal. Before enabling this feature, you should consider the ramifications; since there is a limitation to the number of concurrent scans that you can run based on your license, enabling IDE scans may cause scans triggered by CI/CD pipelines and SCM integrations to be added to the scan queue (run on a "first in first out" basis), causing major delays for those scans.
To rescan an existing branch:
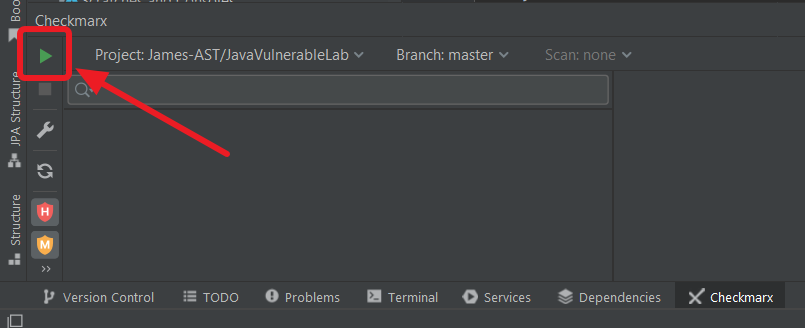
In the Checkmarx panel in your IDE, open the existing Checkmarx project under which your current workspace has already been scanned.
Click on the "Run scan" button that is shown next to the project name.
Notice
Checkmarx runs a sanity check to verify that your current workspace matches the files that were previously scanned under this Checkmarx project. If a mismatch is detected, a warning is shown. You are given the option to run the scan despite the mismatch.
When the scan is completed, a dialog appears, asking if you would like to load the results from the new scan. Click Load scan results to show the new scan results in the Checkmarx panel.
To run a scan, creating a new Checkmarx One branch:
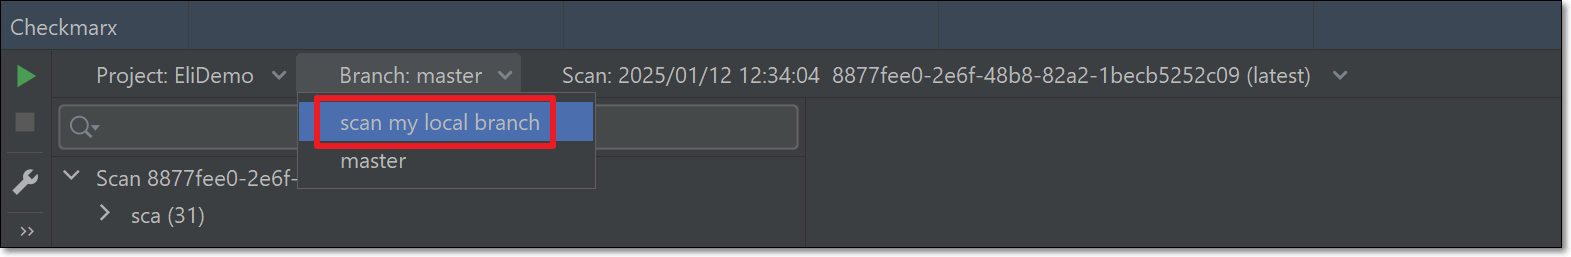
In the Checkmarx panel in your IDE, select the existing Checkmarx project under which your current workspace has already been scanned.
Click on the Branch field, and select scan my local branch.
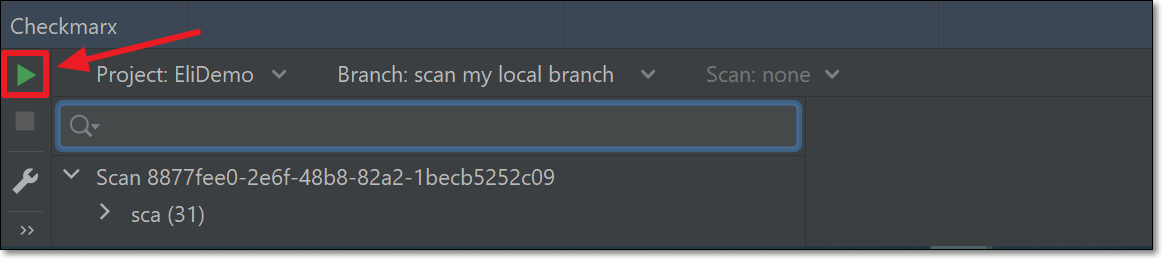
Click on the "Run scan" button that is shown next to the project name.
Notice
Checkmarx runs a sanity check to verify that your current workspace matches the files that were previously scanned under this Checkmarx project. If a mismatch is detected, a warning is shown. You are given the option to run the scan despite the mismatch.
When the scan is completed, a dialog appears, asking if you would like to load the results from the new scan. Click Load scan results to show the new scan results in the Checkmarx panel.
Viewing Checkmarx One Scan Results
There are two methods for viewing Checkmarx One scan results in JetBrains:
Viewing Checkmarx One Scan Results in the Checkmarx Panel
You can open the Checkmarx panel below your project and navigate the tree display to view details about a specific vulnerability.
Notice
In order to show the source code for a specified attack vector, you need to have the relevant project open in your JetBrains console.
To view the Checkmarx One results in the Checkmarx panel:
Notice
The following procedure describes viewing a SAST result. Functionality for other scanners is similar, but not all of the tabs are available. Viewing and Remediating SCA results is described in a separate procedure.
After you import the scan results, and the results are shown in the Checkmarx panel, click on an arrow or double-click a node to expand that node in the tree.
You can use the Checkmarx Toolbar (on the left) to adjust the display, see below.
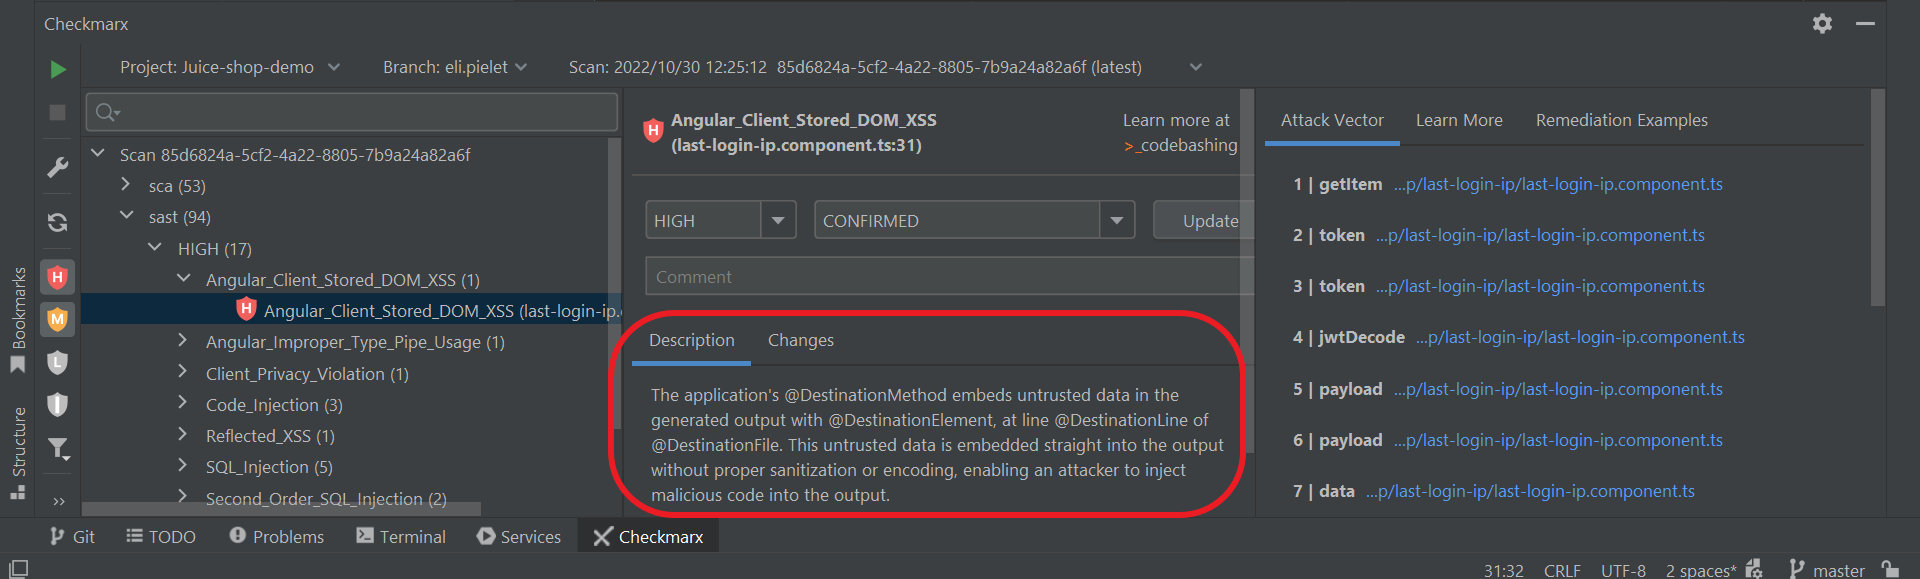
Click on a SAST vulnerability.
The details panel is shown on the right. It opens showing the Description tab, which includes a summary of the vulnerability info.
You can click on the Changes tab to view all changes that have been made to the result predicate of the vulnerability (severity, status and notes), see Triaging Results.
You can click on the Learn More tab to view additional details about the vulnerability, including recommended remediation actions.
You can click on the Remediation Examples tab to view a sample of code that is subject to this vulnerability, followed by a remediated version of that code.
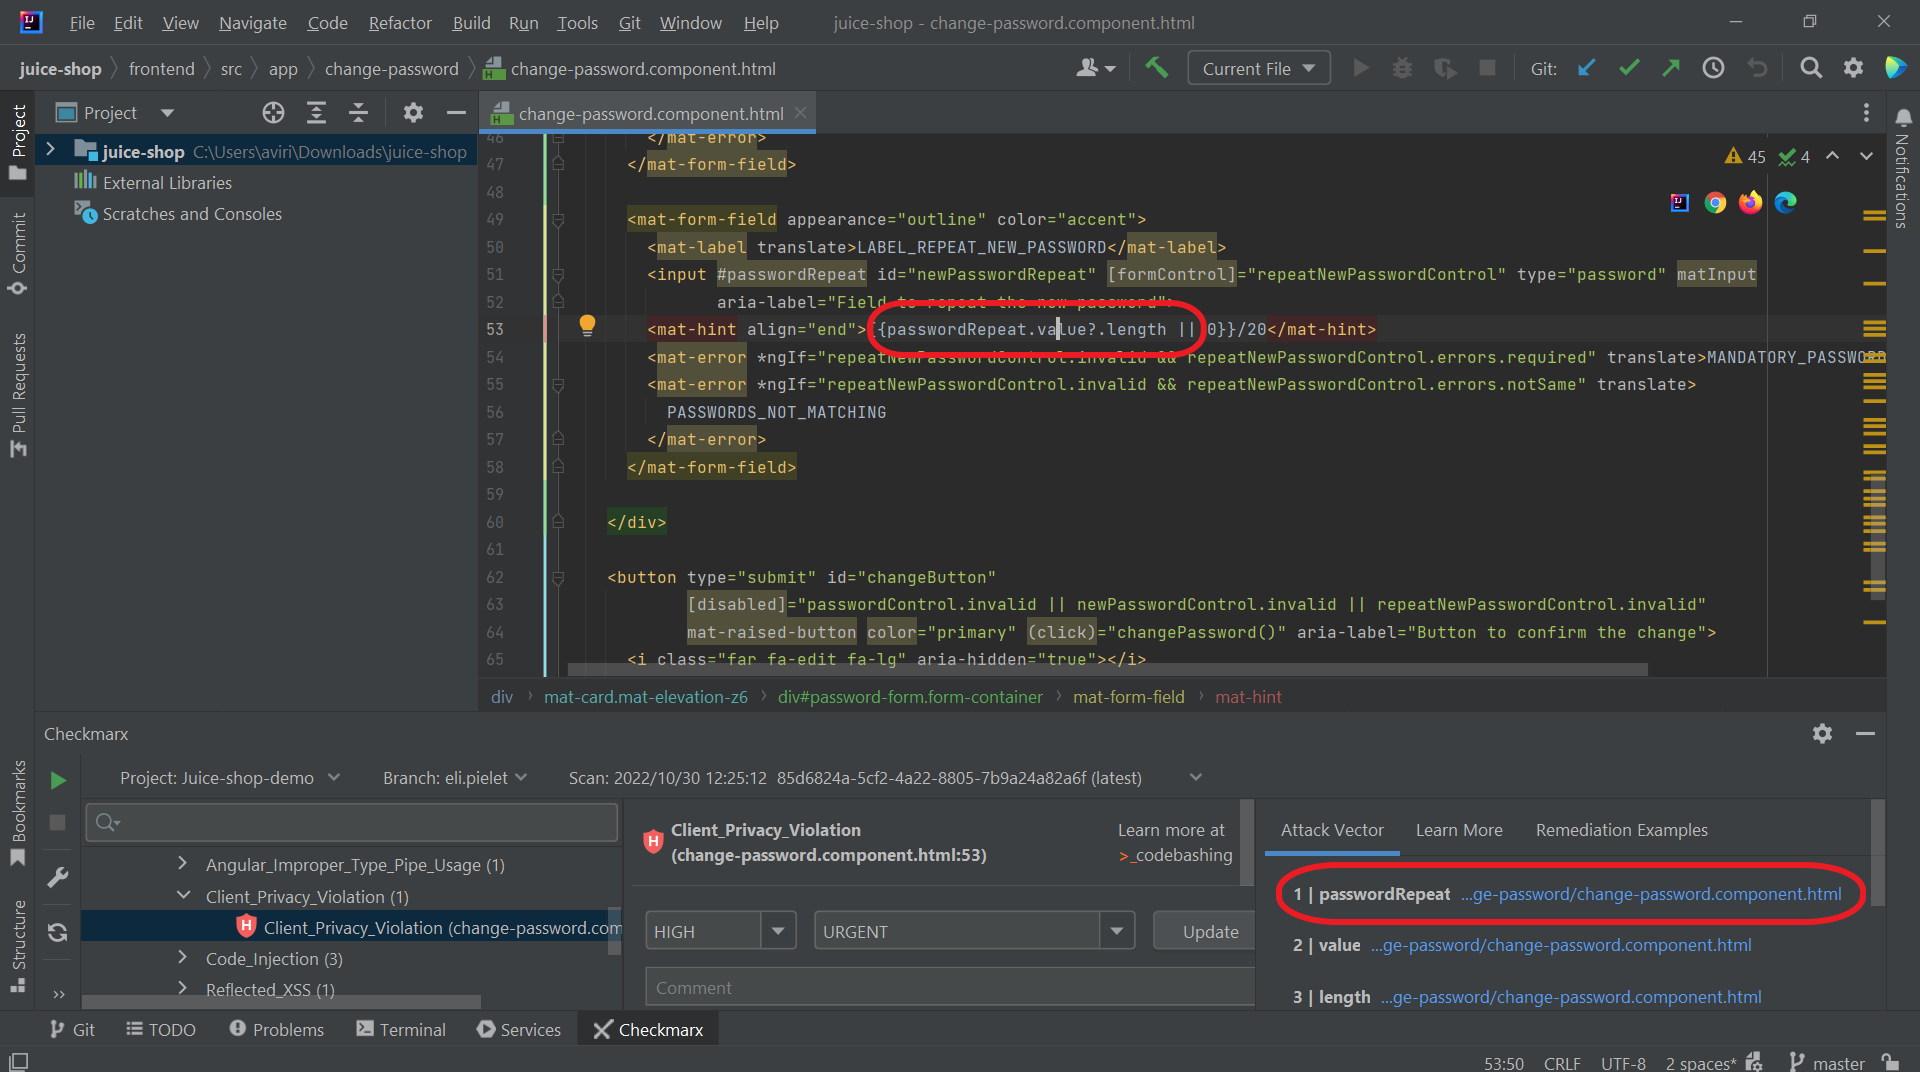
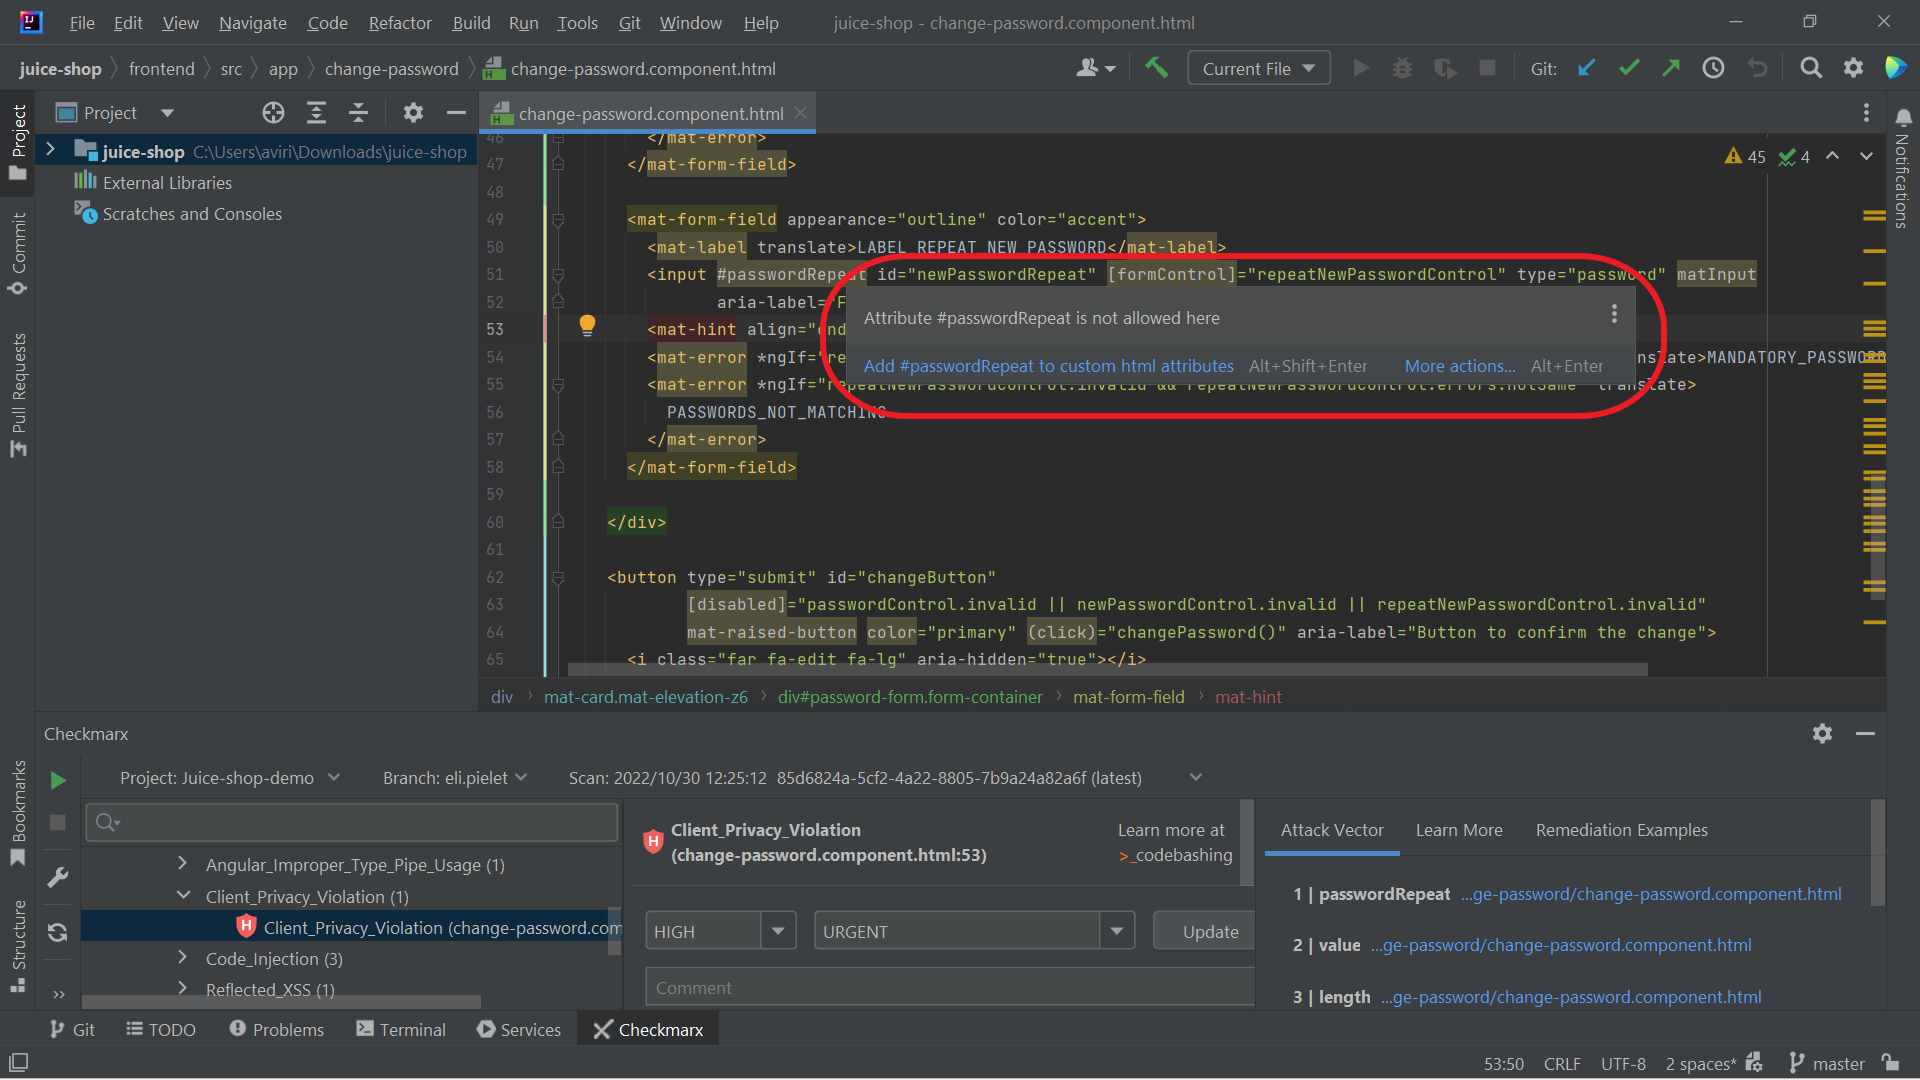
Click on a node in the Attack Vector tab.
An editor opens containing the source code in the respective file and location for the selected node.
Hovering over an error or warning in the code shows a tooltip showing info about the vulnerability.
Viewing and Remediating SCA Results
Click on an SCA vulnerability in the results tree.
Detailed info about the vulnerability is shown in the results window. This includes a description of the vulnerability, info about the package where it was identified and a detailed breakdown of the metrics contributing to the CVSS score.
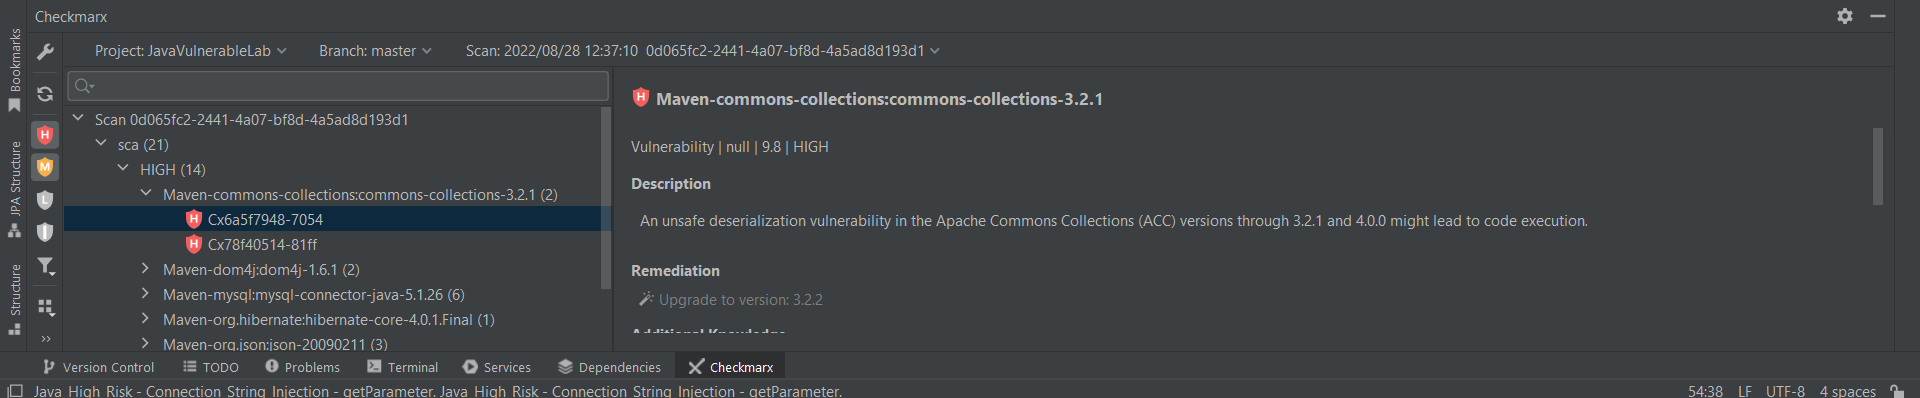
Checkmarx offers remediation recommendations. When the Remediation recommendation is highlighted, this indicates that you can automatically upgrade to the recommended version by clicking on the link.
Notice
This feature is currently supported only for direct npm dependencies.
Checkmarx Toolbar
On the sidebar, on the left side of the Checkmarx panel, a toolbar with the following actions is available:
Icon | Item | Description | |
|---|---|---|---|
| Settings | Opens the Checkmarx One JetBrains plugin configuration settings | |
| Refresh | Clear Project, Branch and Scan selection and refresh the Project selection list | |
| Filter Critical | Show/hide criticle severity vulnerabilities | |
| Filter High | Show/hide high severity vulnerabilities | |
| Filter Medium | Show/hide medium severity vulnerabilities | |
| Filter Low | Show/hide low severity vulnerabilities | |
| Filter Info | Show/hide info severity vulnerabilities | |
| Filter by state | Filter results by state (multi-select, by default all are selected except for Not Exploitable and Proposed Not Exploitable) You can also select "SCA Dev & Test Dependencies" to hide vulnerabilities identified by the SCA scanner in "Dev" and "Test" dependencies. Learn more here | |
| Group By | Select one or more criteria for grouping the results. Options are: Severity, State, Vulnerability Type, Direct Dependency. | |
| Expand All | Fully expand the results tree | |
| Collapse All | Fully collapse the results tree |


Managing (Triaging) Results
Checkmarx One tracks specific vulnerability instances throughout your SDLC. Each vulnerability instance has a ‘Predicate’ associated with it, which is comprised of the following attributes: ‘state’, ‘severity’ and ‘notes’. After reviewing the results of a scan, you have the ability to triage the results and modify these predicates accordingly. For more info about triaging results in Checkmarx One, see Managing (Triaging) Vulnerabilities.
You can triage the results directly in the JetBrains console. This is currently supported for SAST and IaC Security results.
Warning
Only users with the Checkmarx One role update-result (e.g., a risk-manager) are authorized to make changes to the predicate. Only users with the role update-result-not-exploitable (e.g., an admin) are authorized to mark a vulnerability as ‘Not Exploitable’.
To edit the result predicate:
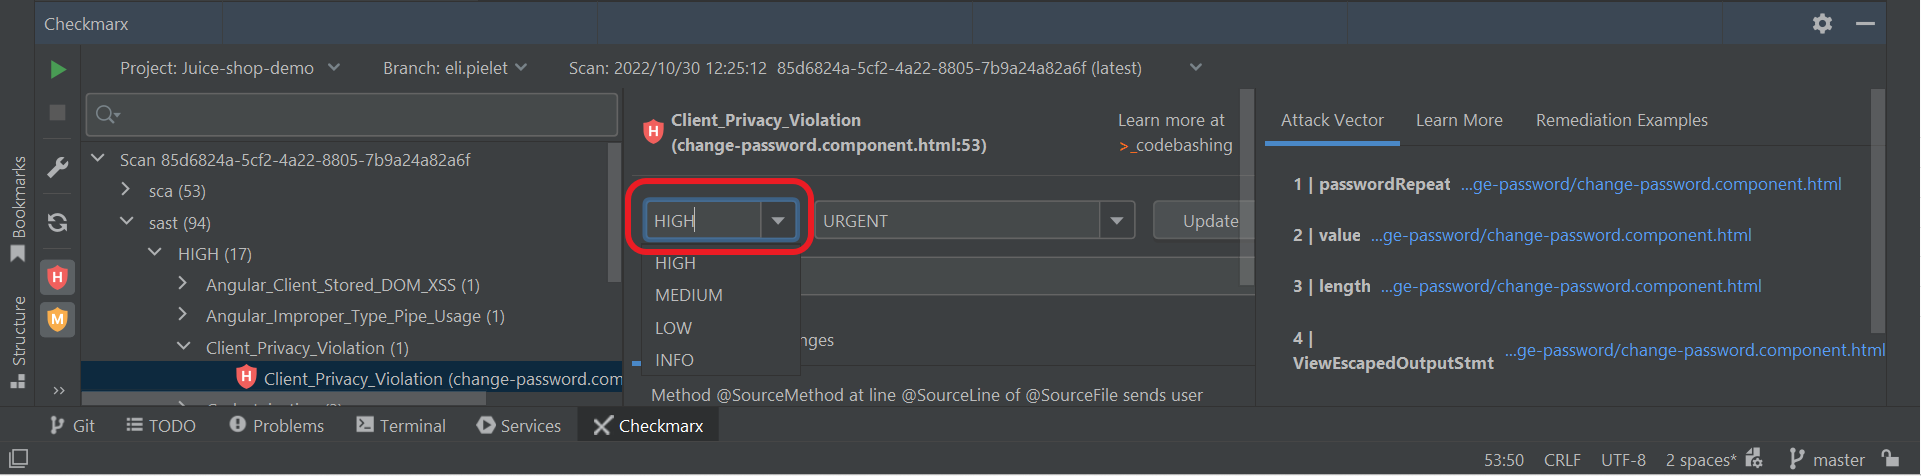
Navigate to the vulnerability that you would like to edit.
To adjust the severity, click on the Severity field, and select from the dropdown list the severity that you would like to assign. Options are: High, Medium, Low or Info.
To adjust the state, click on the State field, and select from the dropdown list the state that you would like to assign. Options are: To Verify, Not Exploitable, Proposed Not Exploitable, Confirmed or Urgent.
To add a note, enter your note in the field Note.
In order to apply your changes, click Update.
The new predicate is applied to the vulnerability instance in this scan as well as to recurring instances of the vulnerability in subsequent scans of the Project. The changes made to the predicate are shown in the Changes tab.
Codebashing Links
Codebashing is an interactive AppSec training platform built by developers for developers. Codebashing sharpens the skills that developers need to avoid security issues, fix vulnerabilities, and write secure code in the first place. See Codebashing documentation here.
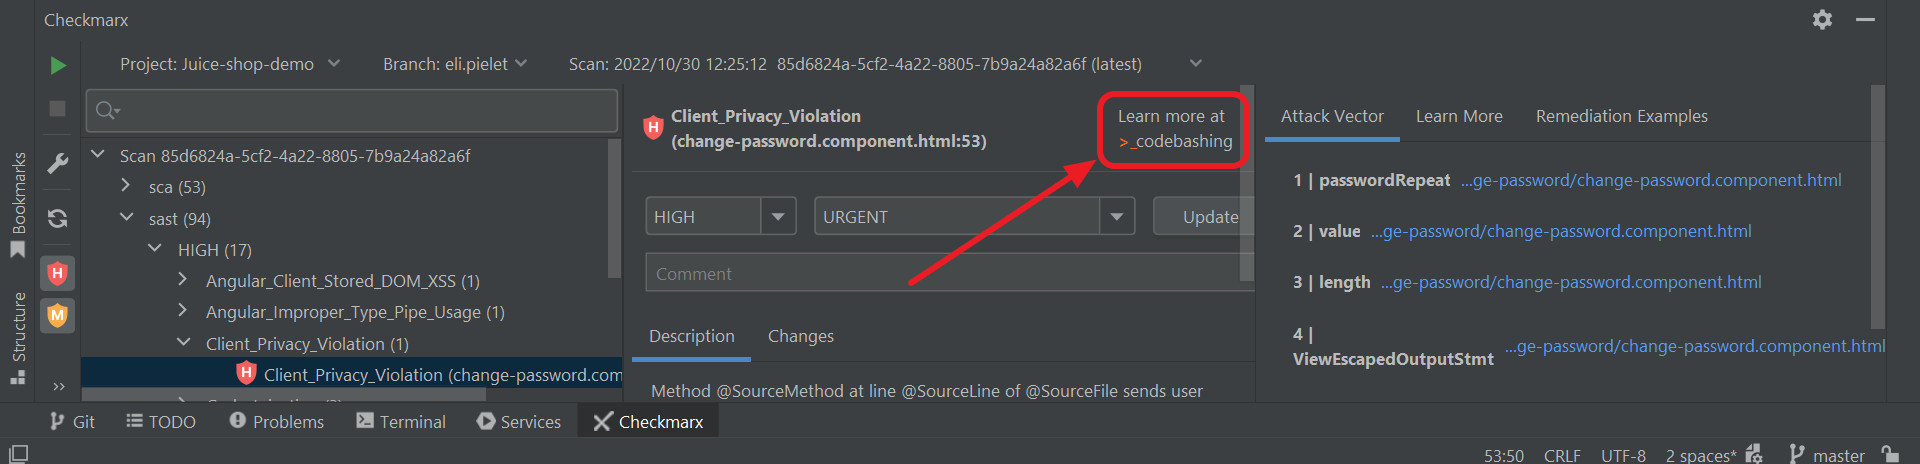
When you select a SAST vulnerability for which a Codebashing lesson exists, a link to the relevant lesson is shown. Click on the link to open the lesson in a new browser.
Warning
In order to access these links, you need to have a Codebashing account that has been linked to your Checkmarx One account. Please contact your Checkmarx support representative for assistance. For users that don't have a linked Codebashing account, a dialog opens with a link to begin a free trial.
 |
Viewing Checkmarx One Results Using the Code Analyzer
You can leverage the JetBrains code analyzer to display the results, see https://www.jetbrains.com/help/idea/code-inspection.html. You can analyze the whole project or set a custom scope. The results of the Checkmarx One scan are shown together with other problems identified by JetBrains in the Problems tab.
To use the Code Analyzer:
After you retrieve the scan results, and the scan ID is shown in the Checkmarx panel, click Code > Analyze Code > Run Inspection by Name.
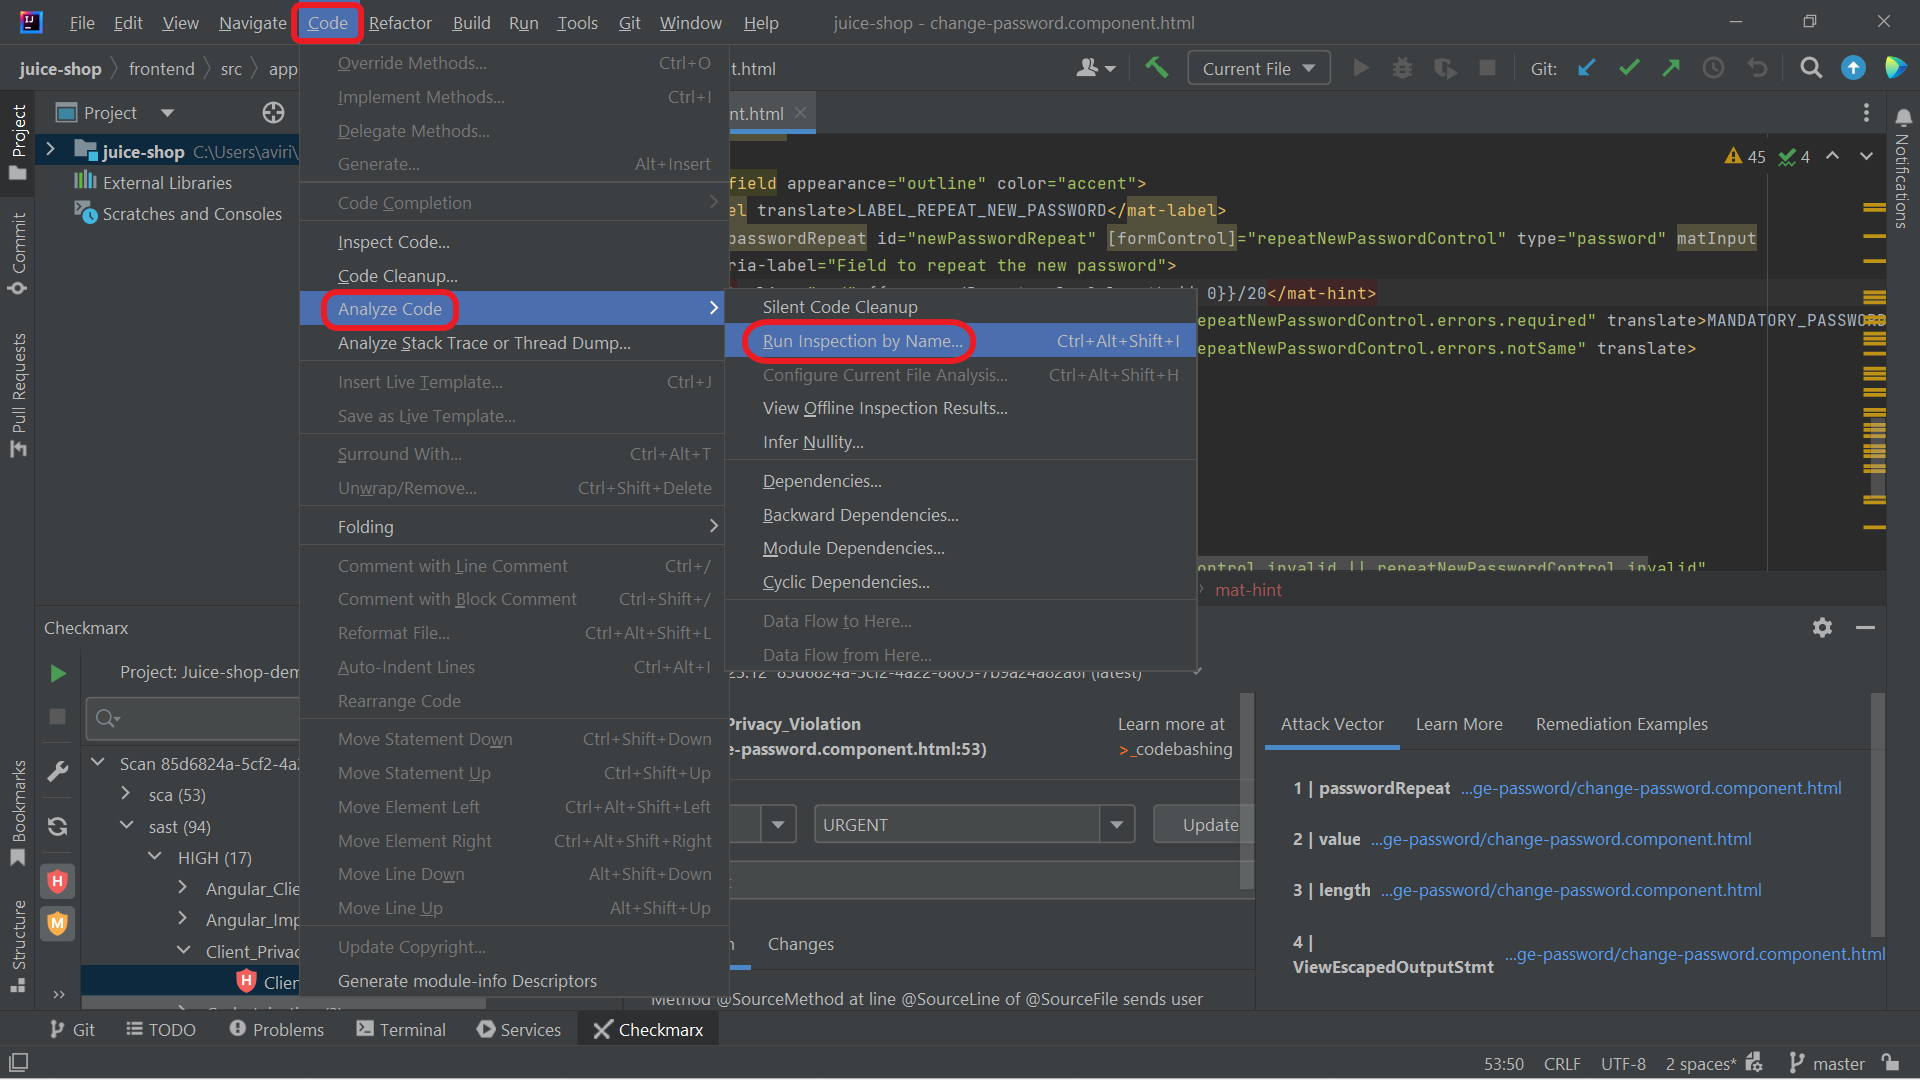
The Enter inspection name window is shown.
In the search field, type Checkmarx to locate Checkmarx AST, and press Enter.
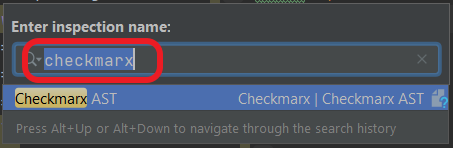
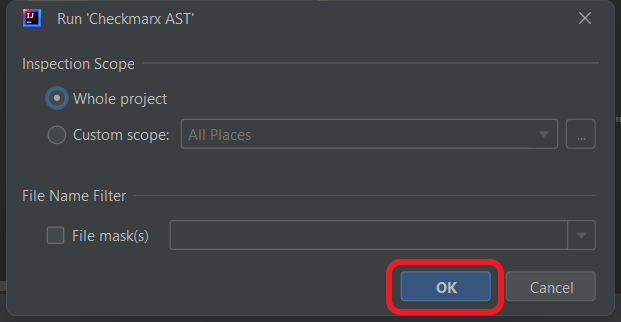
The Run 'Checkmarx AST' window is shown.
For Inspections Scope, leave the Whole project radio button selected (default) to inspect the entire project or select Custom scope and specify the places that you want to inspect, then click OK.
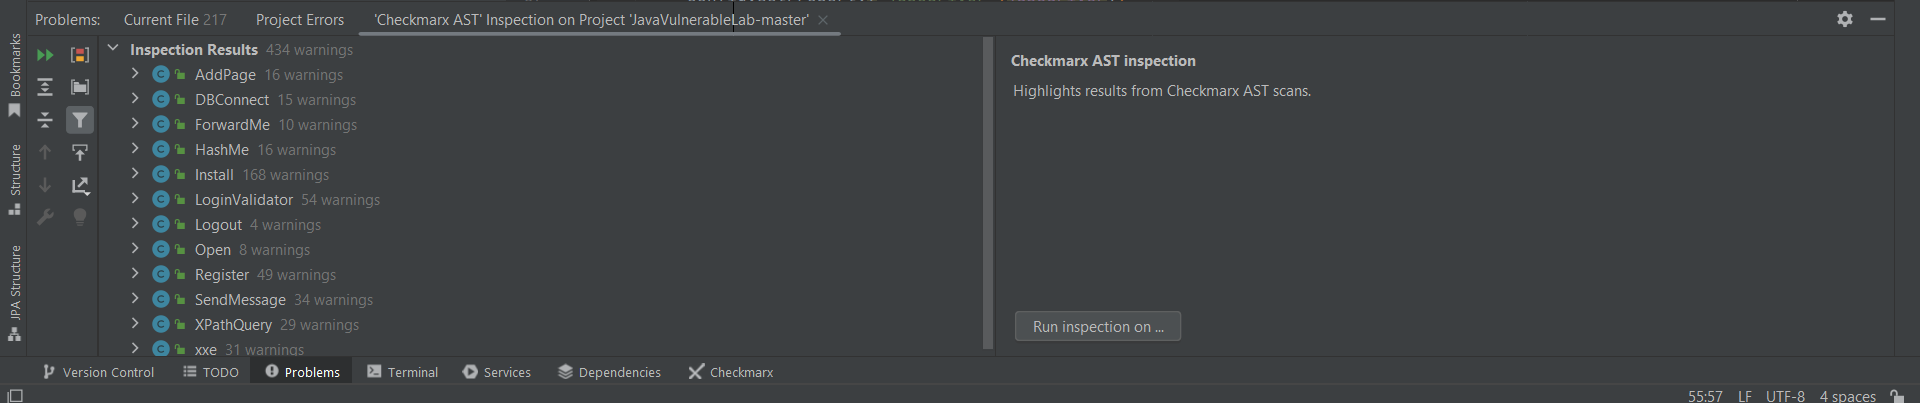
Click on Problems (at the bottom of the screen) to open the Problems tool window.
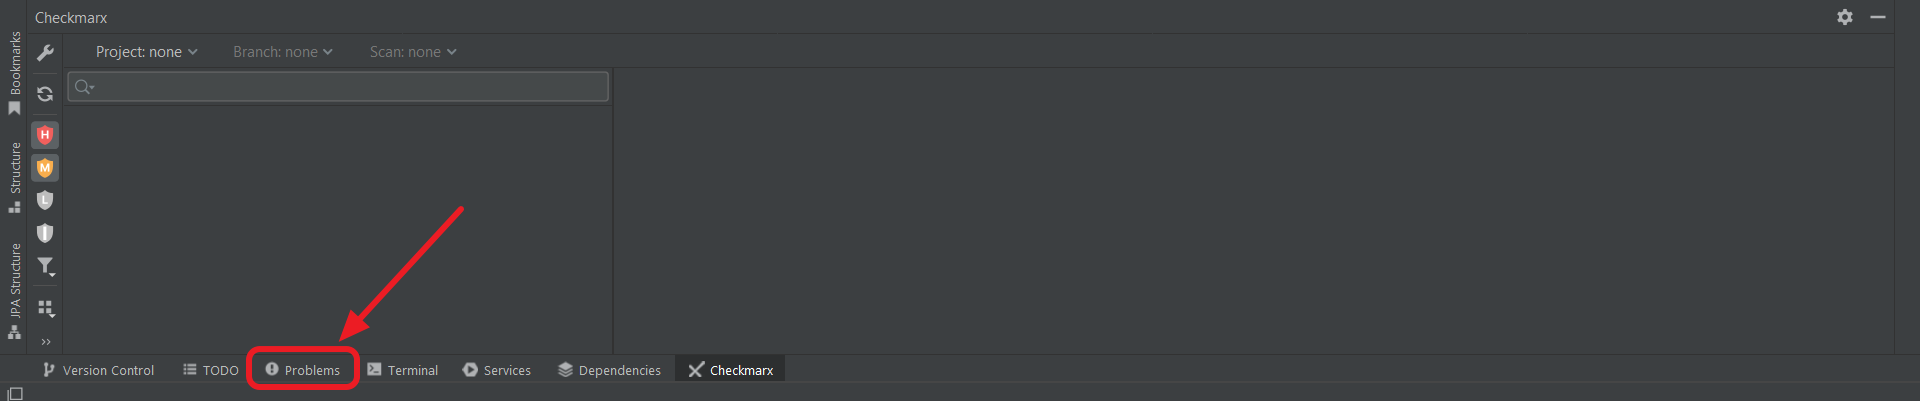
The Problems tool window is shown with any problems that were found, including the Checkmarx One vulnerabilities.