- Checkmarx Documentation
- SAST/SCA Integrations
- CI/CD Plugins
- Azure DevOps Plugin
- Reviewing Scan Results using the Azure DevOps Plugin
Reviewing Scan Results using the Azure DevOps Plugin
Scan results activated by Azure DevOps are displayed in Azure DevOps and SAST. For further information, refer to Navigating Scan Results in the SAST user guide.
Notice
The Synchronous mode, as defined in configuring a Checkmarx Task, enables viewing the scan results in Azure DevOps. If cleared (asynchronous mode), only a link to the scan results in the SAST web application is provided with the build results.
The SCA graph appears in the Azure DevOps user interface, not the SCA system's interface.
To display the Checkmarx report, do the following:
Select the Checkmarx tab showing the scan results of this pipeline job.
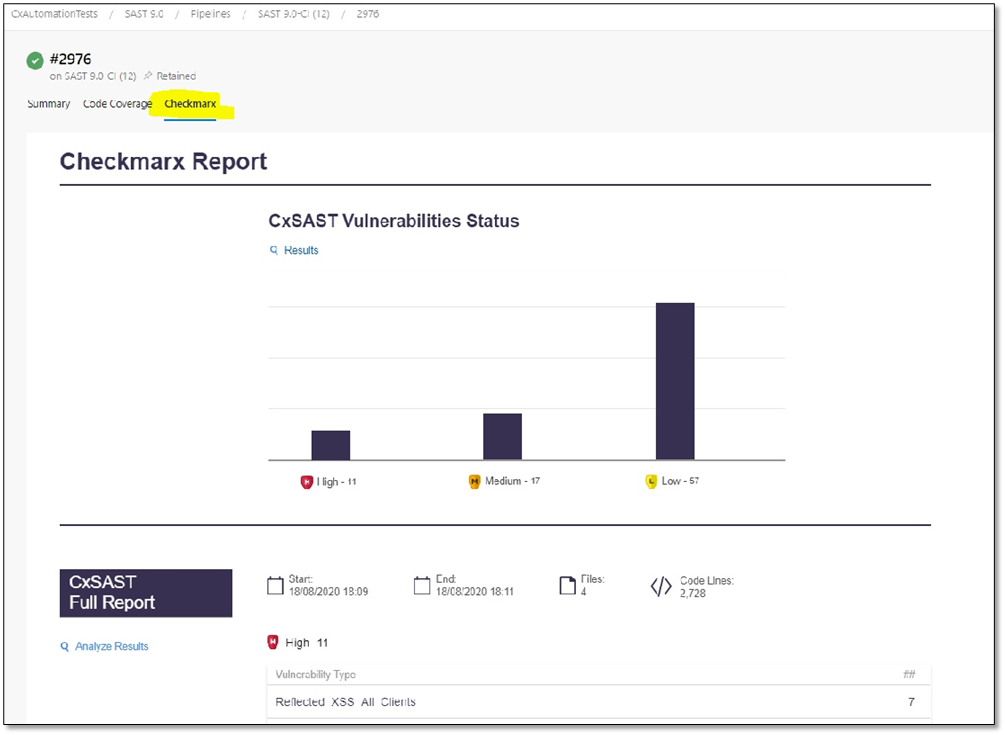
To retrieve and view the latest build results in Azure DevOps:
Open Azure DevOps, and from the Main screen, click Build and Releases and then select Builds. The Build Definition dialog box is displayed.
Navigate to the line of the desired project, click Actions , and click View Build Results. The Build Results Dashboard is displayed.
To review the scan results, do the following:
Scroll down the Build Results dashboard for a graphical summary of the Checkmarx scan results.
Show the Checkmarx (Report) tab on the Build Results dashboard for a detailed version of the scan results.
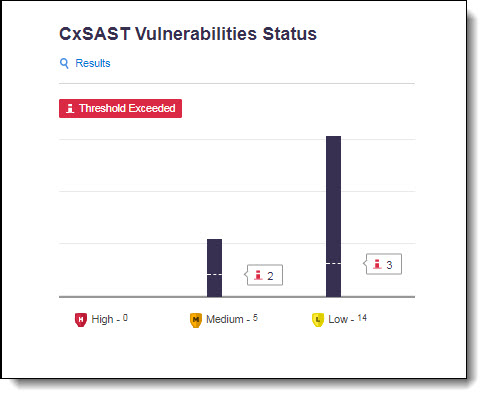
The SAST Summary provides information about the distribution of security issues for the build/project and is divided into the following categories:
This graph represents the status and severity of security vulnerabilities discovered during a scan, as listed in the table below.
Label
Description

Default Threshold
Indicates the default threshold setting.

Critical
Indicates the number of critical-severity vulnerabilities.

High
Indicates the number of high-severity vulnerabilities.

Medium
Indicates the number of medium-severity vulnerabilities.

Low
Indicates the number of high-low vulnerabilities.

Results
Provides a link to the code viewer in SAST. Refer to Navigating Scan Results in the SAST user guide for additional information.

Threshold Status
Provides a threshold status indicator (compliant or exceeded).
Notice
If the build is marked as failed, the detected vulnerability instances may have exceeded the configured threshold.
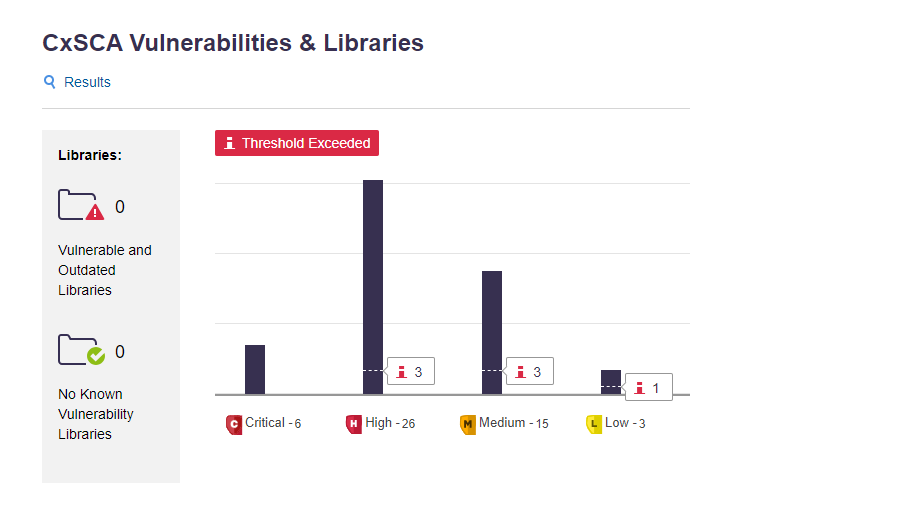
The SCA Summary provides information about the distribution of security issues for the build/project and is divided into the categories listed below. It takes vulnerability result states into consideration, which means that, for example, Not Exploitable vulnerabilities are not included in the global summary.
Label | Description | ||
|---|---|---|---|
Libraries | Lists the vulnerable libraries | ||
| Vulnerable and outdated Libraries | Libraries with at least one security vulnerability and vulnerable libraries for which a newer version is available. | |
| No Known Vulnerability Libraries | Libraries without any known security vulnerabilities | |
Vulnerabilities & Libraries Status | Provides a graph displaying the severity level of each vulnerability and the number of detected vulnerability instances for each severity level | ||
 | Default Threshold | Indicates the default threshold setting | |
| Critical | Indicates the number of critical-severity vulnerabilities | |
 | High | Indicates the number of high-severity vulnerabilities | |
 | Medium | Indicates the number of medium-severity vulnerabilities | |
 | Low | Indicates the number of low-severity vulnerabilities | |
Results | Provides a link to the SCA viewer in SAST | ||
 | Threshold Exceeded | Provides a threshold status indicator (compliant or exceeded) |
Notice
If the build is marked as failed (red), the detected vulnerability instances may have exceeded the configured threshold.
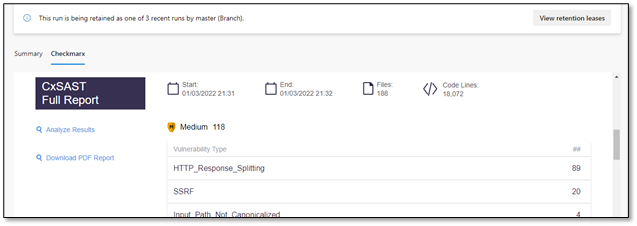
The CxSAST Full Report provides information about the distribution of security issues for the build/project and is divided into the following categories:
Report Criteria – Provide the following information:
Start/End – Start and end time for the SAST scan.
Files – Total number of files scanned.
Code Lines – Total number of lines of code scanned.
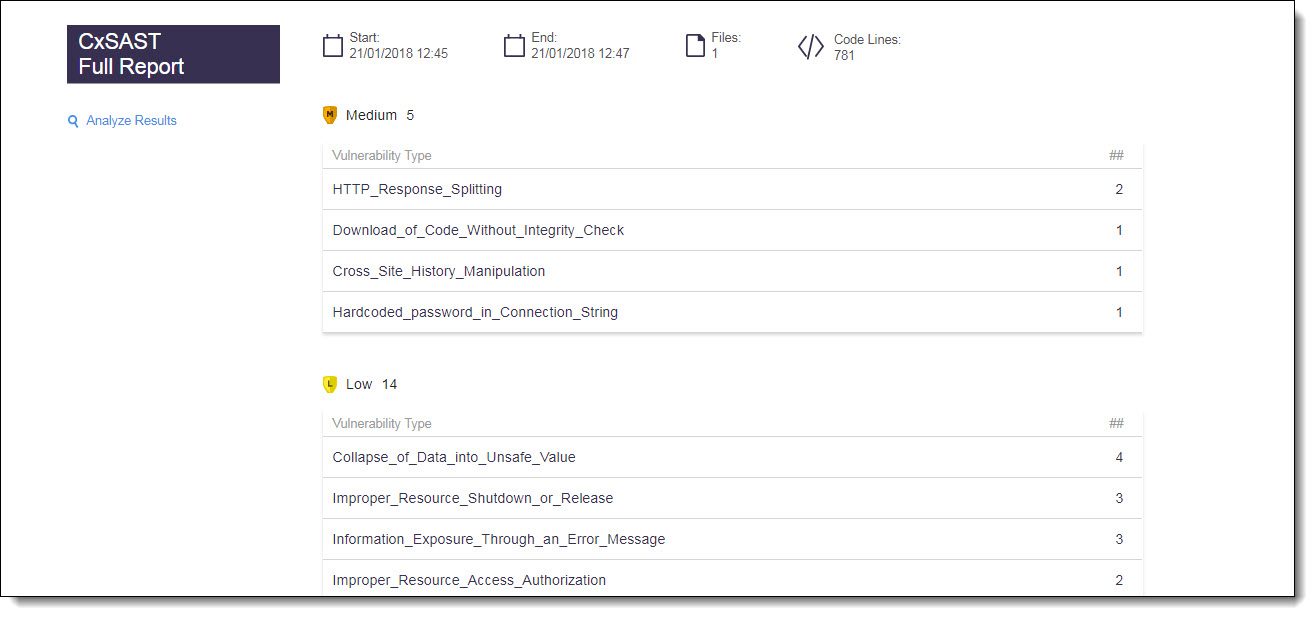
Vulnerability Type – Provides a list of the vulnerabilities found, the distribution of the vulnerabilities by type (critical, high, medium, and low), and the number of vulnerability instances for each type.
Notice
Not exploitable vulnerabilities are not listed in the global summary. The CxSAST Full Report displays Not exploitable vulnerabilities with a strike-through instead.
Analyze Results – This links the vulnerability results in the CxSAST code viewer. Refer to Navigating Scan Results in the SAST user guide.
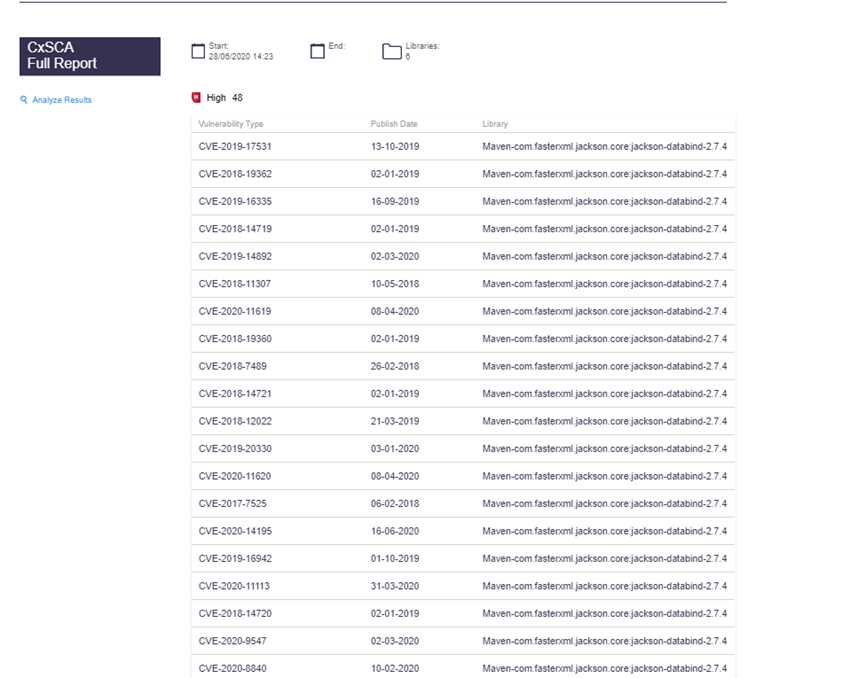
The CxSCA Full Report provides information about the distribution of security issues for the build/project. It is divided into the following categories:
Report Criteria – provides the following information:
Start – start and end time for the SCA analysis.
End field – display with an empty value.
Libraries – total number of libraries analyzed.
Vulnerability Type – Provides a list of the identified vulnerabilities, the distribution of the vulnerabilities by type (critical,high, medium, and low), and the number of vulnerability instances for each type.
Notice
Not exploitable vulnerabilities are not listed in the global summary. The CxSCA Full Report displays Not exploitable vulnerabilities with a strike-through instead.
Analysis Results – provides a link to the SCA report.
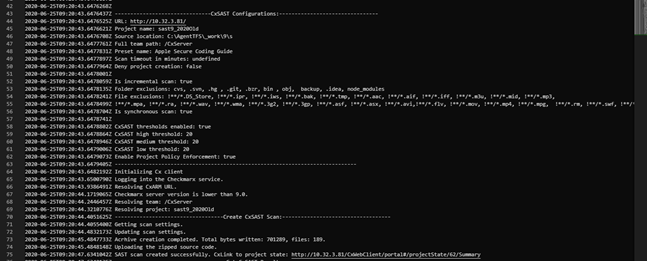
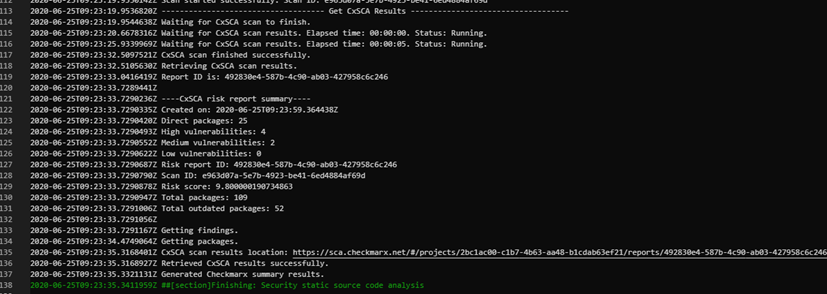
A textual summary of the results can be viewed under Build # > Summary tab> Application security testing Output as follows:
For SAST:

For SCA:

Once the build is complete, three new json files are created in the folder of the running agent. The folder path and name are similar to C:\Agent\_work\xx.
json File | Description |
|---|---|
cxSCAPackages_buildNumber.json | Displays the relevant SCA package details. |
cxSCASummary_buildNumber.json | Displays the relevant SCA summary. |
cxSCAVulnerabilities_buildNumber.json | Displays the relevant vulnerability details. |
Notice
The JSON files for each build are preserved and not overwritten by newer ones.
Once the build is complete, a PDF file is generated in the folder of the running agent from the scan report page by following the Download PDF Report link. The folder names are similar to C:\agent\work\xx. Newer ones do not overwrite the generated PDF files for each build.
