Working with Scan Results
When viewing or auditing a project in CxAudit, you can view and manage scan results in a similar way as in CxSAST's interactive scan results interface.

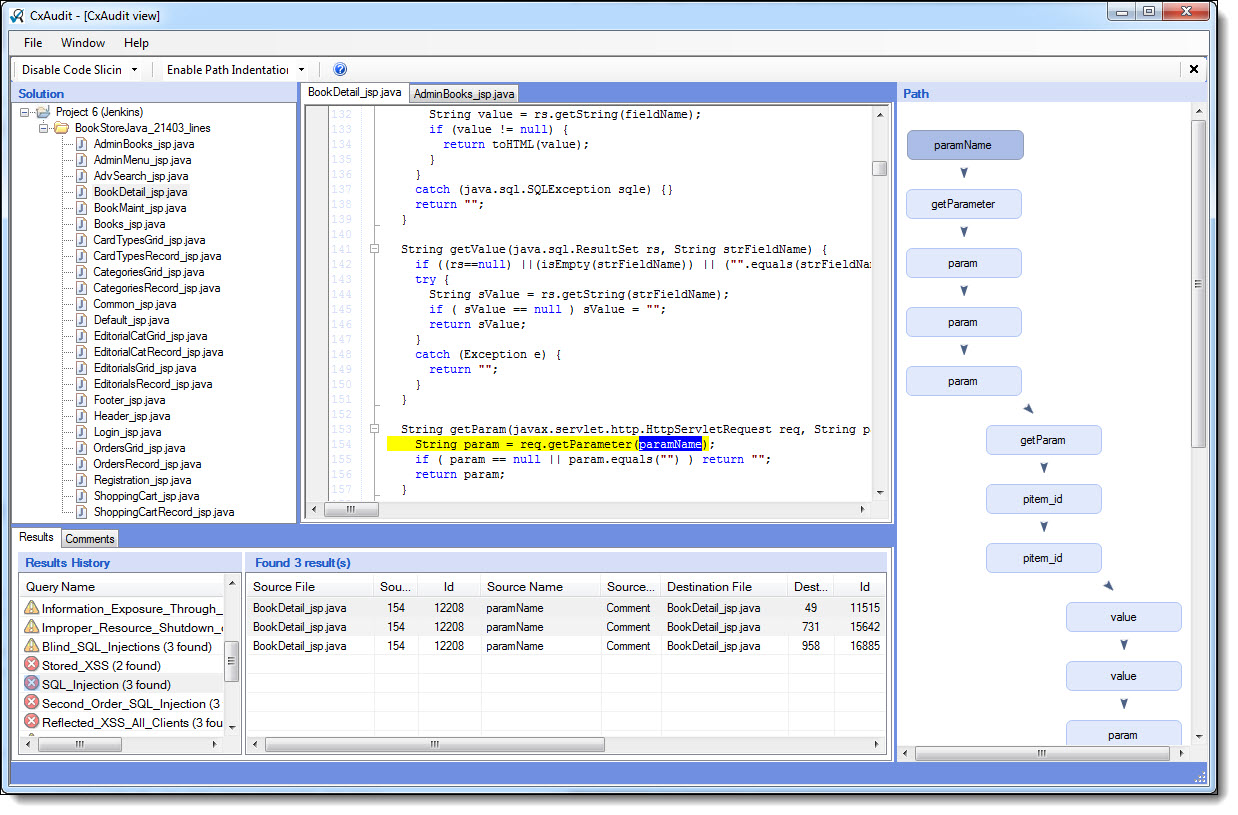
The Results window includes the following panels (in drill-down order):
Results (bottom pane) - Includes two parts:
Results History - Query Name -List of queries with scan results in the current project and also includes the number of instances found.
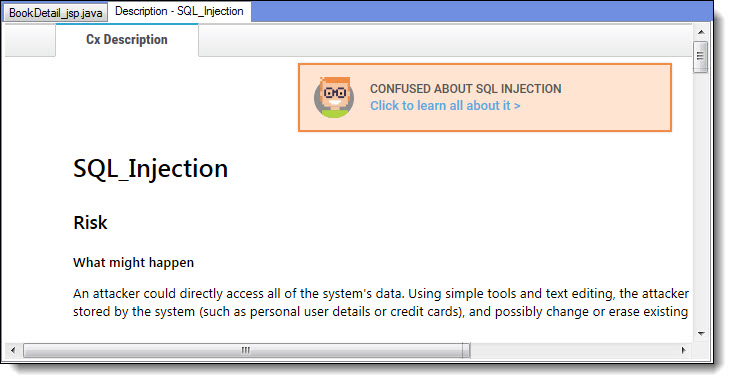
Right-click on a query from the list and select Show Description. Cx/CWE description information for the vulnerability is displayed.

Clicking  takes you to Codebashing, our interactive learning platform, where you can learn about code vulnerabilities, why they happen, and how to eliminate them. Once there, select a tutorial and start sharpening your skills.
Codebashing™
CxSAST users can have free access to a limited set of Codebashing lessons.
Available free lessons are: SQL Injection (SQLi), Cross-site scripting (XSS), XML Injection (XXE). The free lessons are available for the following programming languages: Java, .Net, PHP, Node.JS, Ruby, Python.
The full (paid) version will include over 150+ individual lessons across many common web, mobile and embedded programming languages. Please refer to Codebashing for a full list of supported programming languages and lessons.
Select a query to view instances found to the right.
Found Results - Tabular list of instances found for the selected query, with their details. Select found instances to Comment on it, to change its State (to Verify, Not Exploitable, Confirmed, Urgent or Proposed Not Exploitable) or Severity (Information, Low, Medium, or High), or to Assign to User. These results are maintained for the project for future scans, for instances that continue to be found.
Select an instance to view its attack vector in the Path pane:
Path (right-hand pane) - The full path of code elements that constitute the vulnerability instance selected in the Results pane. You can move along the path with shortcuts F11 (down) and F12 (up).
When Enable Path Indentation is selected in the toolbar, then when the path moves to another source code file, the path shifts diagonally sideways.
Select a code element in the Path pane to view it in its code context, in the Source Code pane:
Source Code (upper-middle pane) - Tabs for each open source code file. The line in the code that contains the element selected in the Path pane is highlighted. To 'grey out' all the other code lines, in the toolbar, select Enable Code Slicing.
Solution - The open project's files. Select a file to view its contents in the Source Code pane to the right.