Navigating Scan Results
After completing a scan, SAST organizes and summarizes the results into four different panes which you can navigate in the web interface (viewing scan results ):
Code. Displays the code with the detected vulnerability highlighted in the code.
Path. Displays the full path of 'vulnerable' code elements.
Queries. Defines how to present the query results.
Results. Displays the result as a table or a graph with background information on detected vulnerabilities.
 |
Scanned Code Queries
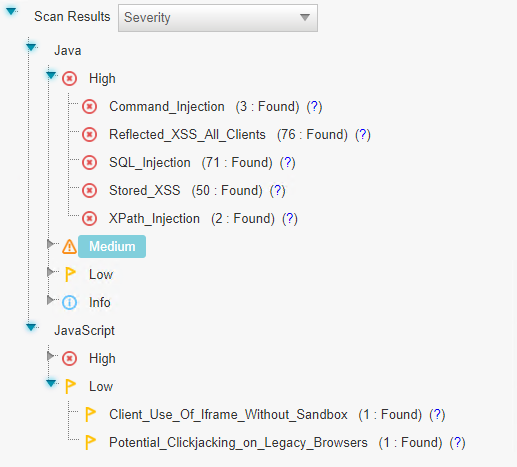
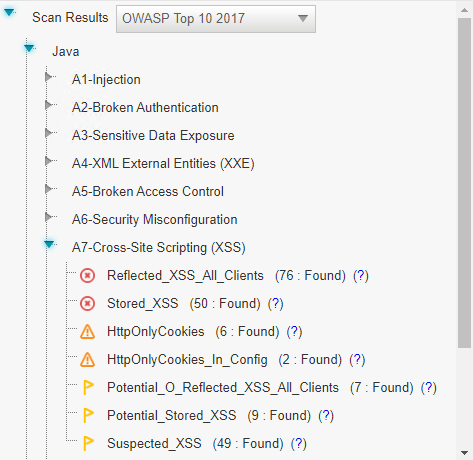
Lower left pane: Each item on the list is a specific type of vulnerability where CxSAST queries the scanned code and lists the number of detected instances of the respective vulnerability found. The queries are sorted by code language, severity, and category.
 |
The drop-down menu lets you select the definitions for displaying detected vulnerabilities.
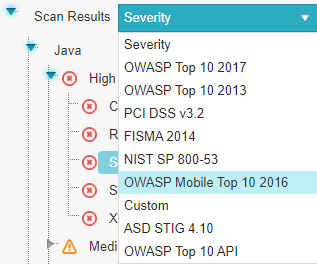 |
Severity - displays application security risks (vulnerabilities) by severity: High
 , Medium
 , Low
, Low , and Info
 .
.OWASP Top 10 2017 - displays the vulnerabilities associated with categories (A1 to A10) that appear on the list of the 10 most serious risks, as defined by OWASP (Open Web Application Security Project). All vulnerabilities not falling into the OWASP Top 10 2017 categories are listed as Uncategorized.
OWASP Top 10 2013 - displays the vulnerabilities associated with categories (A1 to A10) that appear in the list of the 10 most serious risks, as defined by OWASP (Open Web Application Security Project). All vulnerabilities that do not fall into the OWASP Top 10 2013 categories are listed as Uncategorized.
PCI DSS v3.2 - displays the vulnerabilities associated with categories (DSS v3.2), as defined by PCI (Payment Card Industry). All vulnerabilities that do not fall into any PCI category are listed as Uncategorized.
FISMA 2014 - displays the vulnerabilities associated with categories (2014), as defined by FISMA (Federal Information Security Modernization Act). All vulnerabilities that do not fall into FISMA categories are listed as Uncategorized.
NIST SP 800-53 - displays the vulnerabilities associated with categories (SP 800-53), as defined by NIST (National Institute of Standards and Technology). All vulnerabilities that do not fall into any of the NIST categories are listed as Uncategorized.
OWASP Mobile Top 10 2016 - displays the vulnerabilities associated with categories (M1 to M10) that appear in the list of the 10 most serious risks, as defined by OWASP (Open Web Application Security Project). All vulnerabilities that do not fall into the OWASP Mobile Top 10 2017 categories are listed as Uncategorized.
Custom - a user-designed definition for rating the security levels. Using the Custom definition requires integrating the user's severity rating method with CxSAST. For more details, please contact Checkmarx support.
ASD STIG 4 10 - displays vulnerabilities categorized by the DISA Application and Development STIG once the STIG post-installation script has been run.
OWASP Top 10 API
For example, selecting OWASP Top 10 2017 will display the following panel with the detected vulnerabilities:
 |
Notice
To learn more about each vulnerability, click (?) to view additional information provided by Codebashing.
Results Summary
In the lower-left pane is the results summary, you can view detected vulnerabilities, how they are related in a graph, and improve your developer skills with Codebashing to mitigate future similar code vulnerabilities.
Results: View a list of detected vulnerabilities and select them for further action.
Graph: View a graphical display that displays affected code elements and their relationship.
Codebashing: Learn more about detected instances using Codebashing.
Results Tab
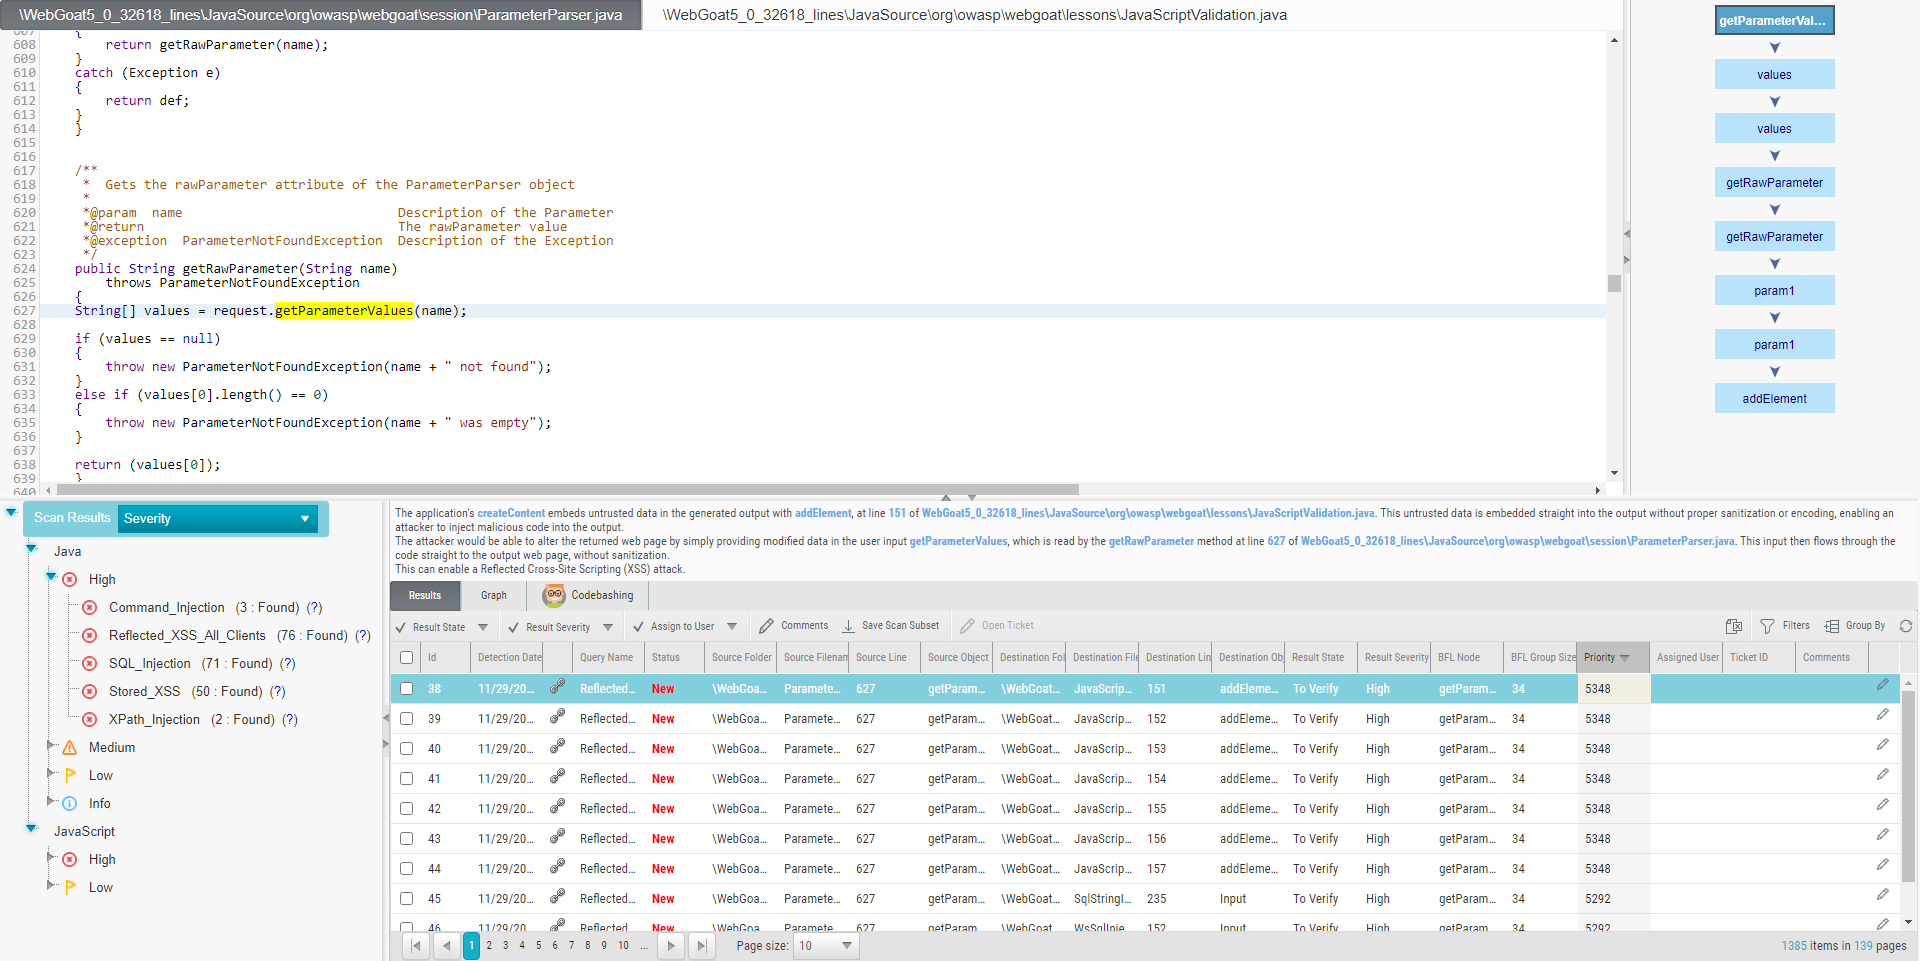
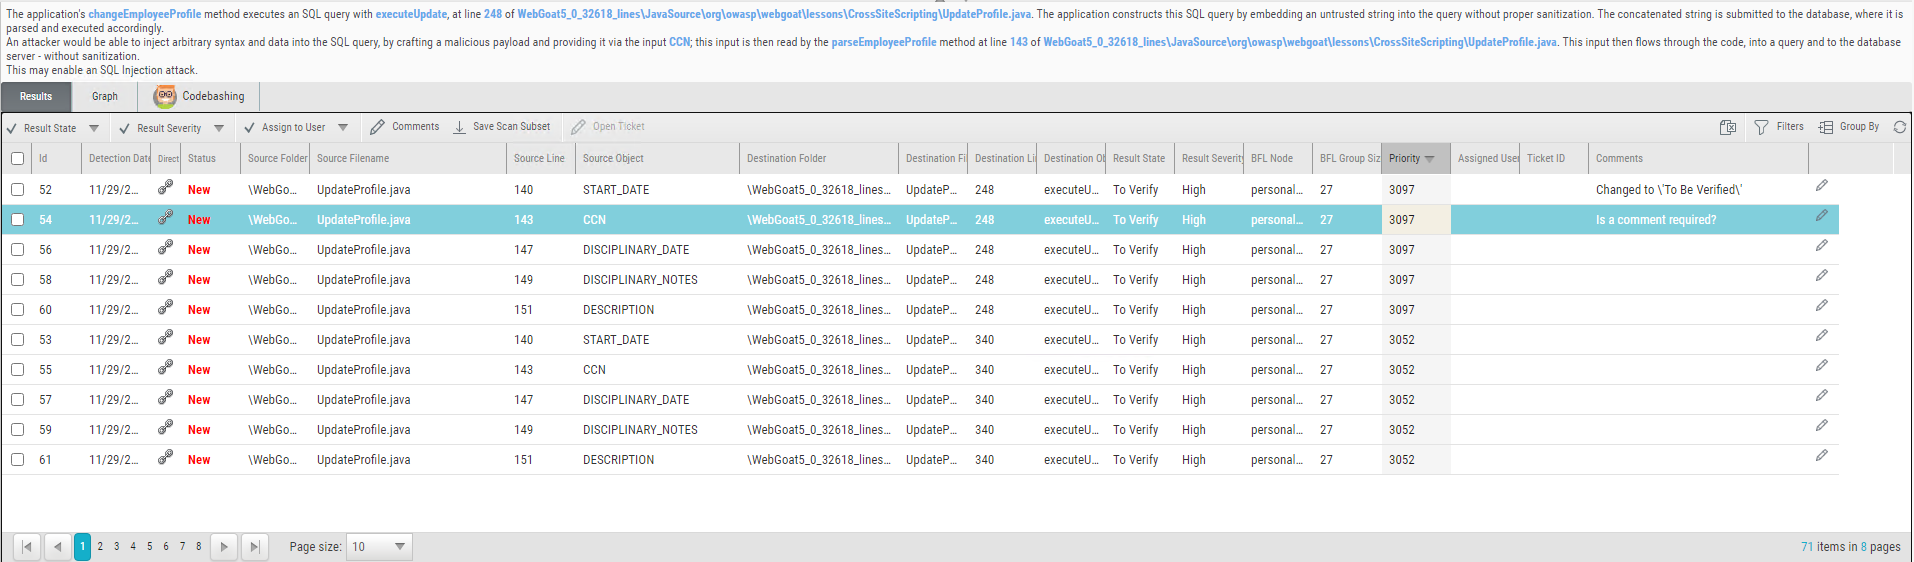
To view a list of detected instances and details, select Results. The highlighted instance's code element details appear at the top. You can navigate the results using pagination controls.
 |
Select an instance node (Graph tab) or a listed result (Results tab)  to change the following (depending on your user permissions):
 | Useful for disregarding false positives or for planning which results to address.
Notice
| |
| The following options are available for defining the priority level of the selected issue: High, Medium, Low, and Info. | |
| Useful for assigning vulnerability results to a specific user to handle. | |
| Add a comment to an instance. This metadata is maintained for the project when performing future scans and for instances that continue to be found. When adding a comment, it is logged with the date and time in the comment history. | |
 | Use this option for selected instances to appear in the results list as an independent result set. | |
| Click to open a ticket in a bug tracking system, like JIRA. |


The results are listed with the following parameters:
Selector: Check to select
the desired result to perform the tasks listed above.ID: The ID of the respective scan.
Detection Date: The date when the vulnerability was detected for the first time in the scanned code.
Direct: Click
 to copy the direct URL of this vulnerability to the clipboard. You can use this link to log on from a different host and directly access CxSAST and this vulnerability report.
Query Name: The name associated with the query of the source code.
Status: The status of the result, for example, New (newly detected).
Source Folder: The folder of the resource with the detected vulnerability.
Source File Name: The name of the resource file in which the vulnerability was detected.
Source Line: The line number in the source code where the vulnerability was detected.
Source Object: The object where the vulnerability was detected. Once you select the list entry, the object appears highlighted in the resource available in the upper left window.
Destination Folder: The destination of the resource.
Destination File Name: The name of the destination file for the resource with the vulnerability.
Destination Line: The line number in the destination.
Destination Object: The destination object, for example, the output of the source.
Result State: The status of the result. The result state can be updated. For available status options, refer to the table above. Updating the result state automatically adds a comment to the comment section.
Result Severity: The severity of the result. The severity can be updated. For available severities, refer to the table above. Updating the result severity automatically adds a comment to the comment section.
BFL Node: Best Fix Location. This parameter defines the node where the fix of the vulnerability is most efficient and effective.
BFL Group Size: Defines the group size that the fix should have.
Priority: Defines the priority at which the vulnerability should be handled.
Assigned User: Lists the user to whom this vulnerability has been assigned. To assign a user, refer to the table above.
Ticket ID: The ID of the ticket, if assigned. For additional information on opening a ticket, refer to the table above.
Comments: User comment box for notes and text. A comment is added automatically if updating the result severity or result state. To add a comment, click
 and enter the comment into the Comment field. Once the comment is saved, it is timestamped under Comments History.
Applying Filters in Results Viewer
By clicking Filters, you can use filters to specify the results you see under the Results tab and refine and customize your scan results based on specific criteria.
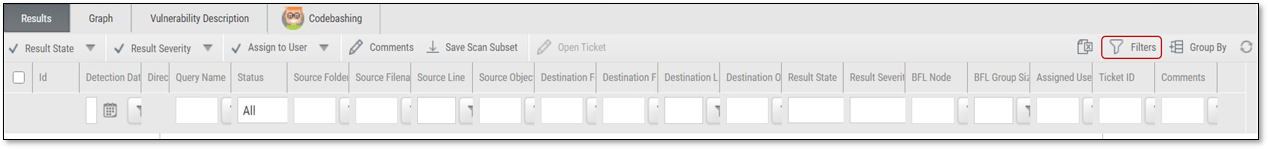
Each filter has a dropdown list of preconfigured filters tailored to the parameters of the scan to narrow down your results. In some dropdown lists, you may only select one filter to use.
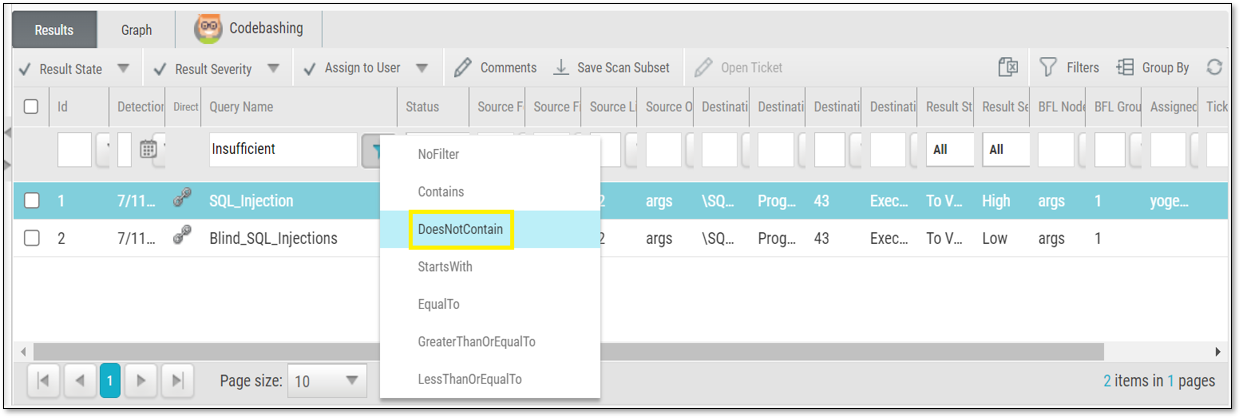
In other dropdown lists, select multiple filters to apply.
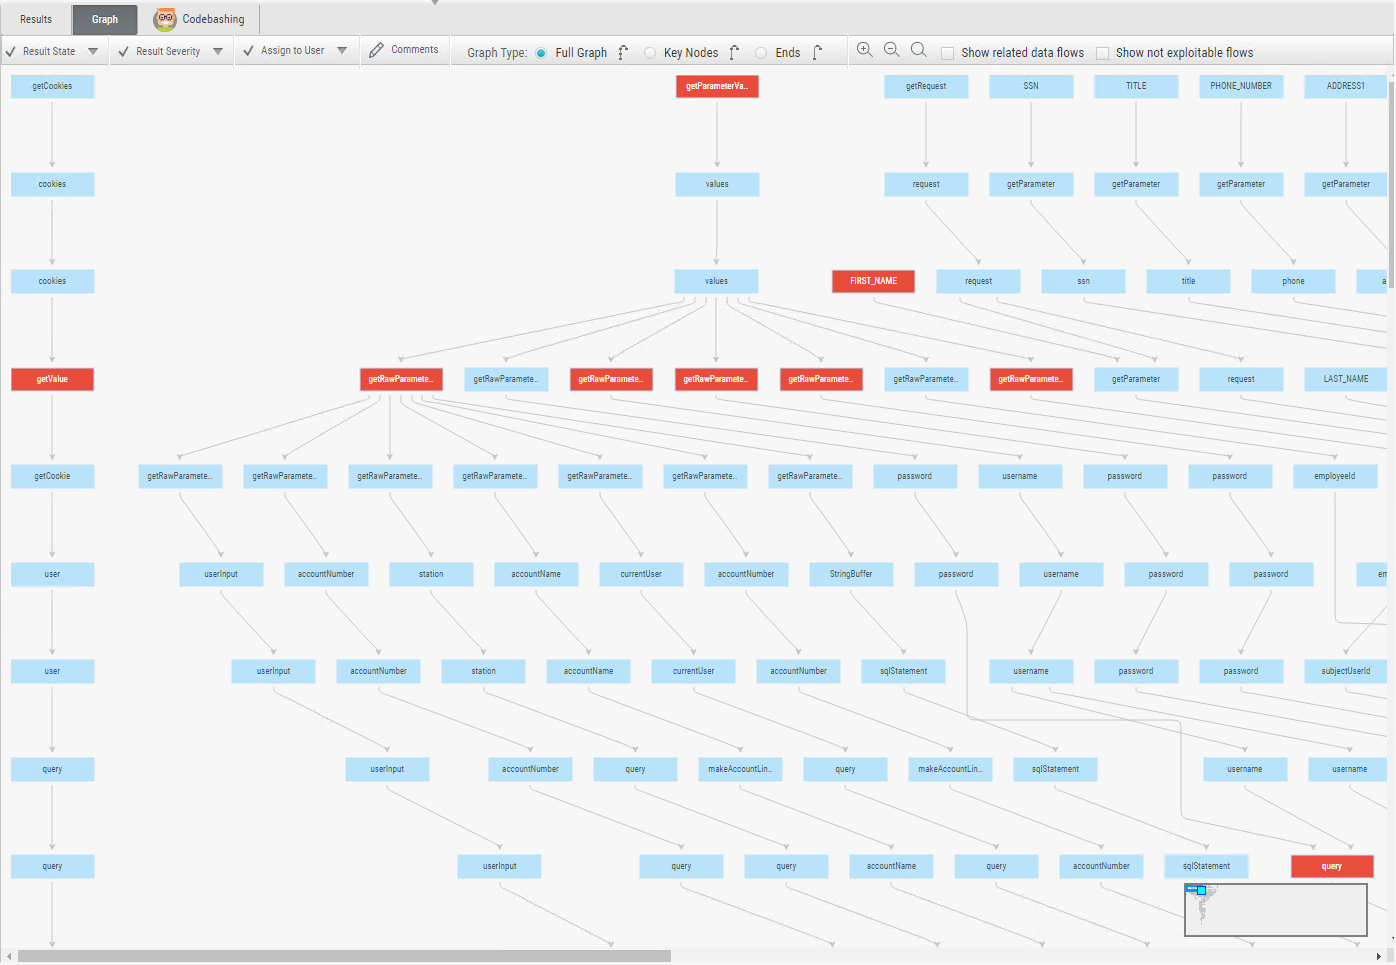
Graph Tab
Select Graph to display each detected instance's first and last code elements with the relationships between them.
 |
Notice
In the Checkmarx SAST IDE Plugins, the Graph pane displays and relates full paths of the code elements found within the vulnerability instances.
Best Fit Locator: The Best Fit Locator is the strategic mitigation point (highlighted in red on the graph) where remediation of vulnerable code is most efficient and effective. When attack vectors for multiple vulnerabilities pass through a particular node, by adding a sanitizer or validation for that node, you can redress several different vulnerable data flows in one action. This greatly reduces the time and effort required to secure your code.
Codebashing Tab
To learn more about code vulnerabilities, why they happen, and how to eliminate them, select  Codebashing - the interactive Checkmarx learning platform. Codebashing provides developers with in-context instructions to better understand vulnerabilities and write secure code. Codebashing is included as a free version with basic capabilities. Additional learning material and in-depth information are available with the full version.
The free edition of Codebashing includes:
Lessons: SQL Injection (SQLi), Cross-site scripting (XSS), XML Injection (XXE)
Languages: Java, .Net, PHP, Node.JS, Ruby, Python
The full version includes over 20 more lessons and additional languages:
Lessons: Session fixation, Use of insufficiently random values, Reflected XSS, Command Injection, DOM XSS, Directory (Path) Traversal, Privileged Interface Exposure, Leftover Debug Code, Session Exposure in URL, User Enumeration, Horizontal Privilege Escalation, Vertical Privilege Escalation, Authentication Credentials in URL, Cross Site Request Forgery (POST), Cross Site Request Forgery (GET), Click Jacking, Insecure URL Direct.
Languages: Scala, C/C++.
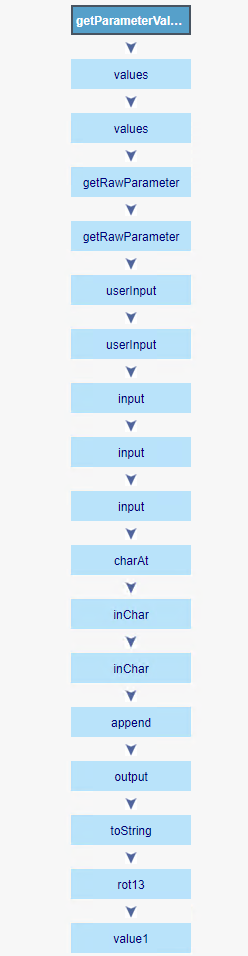
The Path Pane
The Path Pane displays the full path of code elements and attack vectors of the vulnerability instance selected in the Results pane.
To view the attack vector:
Select an instance in the Results pane (Results or Graph tab) and view its attack vector in the Path pane. The code line containing the element that has been selected in the Path pane is highlighted.
 |
Notice
The Number of Nodes column in the Results panel shows the number of nodes in the attack vector provided by each result. Sorting, filtering, and grouping options are available. This column is disabled by default and can be made available from the Columns selection tool.
When using the Checkmarx SAST IDE Plugins, you can fix the code immediately in-app.
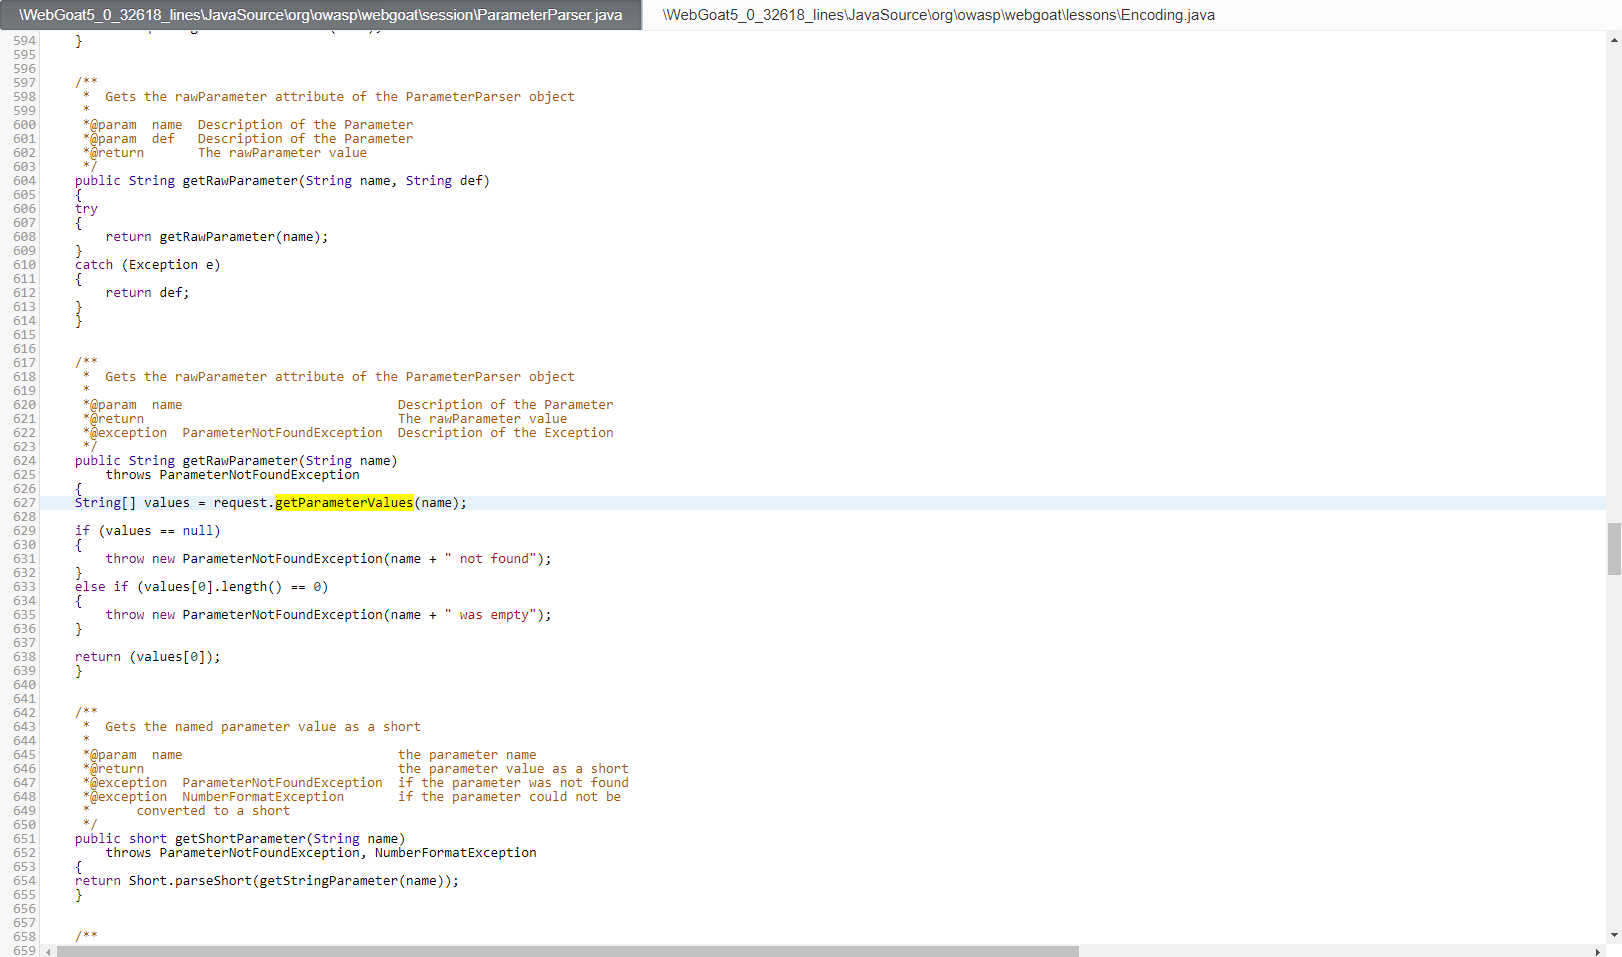
The Code Pane
The Code Pane displays the source code of your scanned file with its detected vulnerabilities marked. Use the Path pane or Results pane to highlight detected vulnerabilities in code.
 |
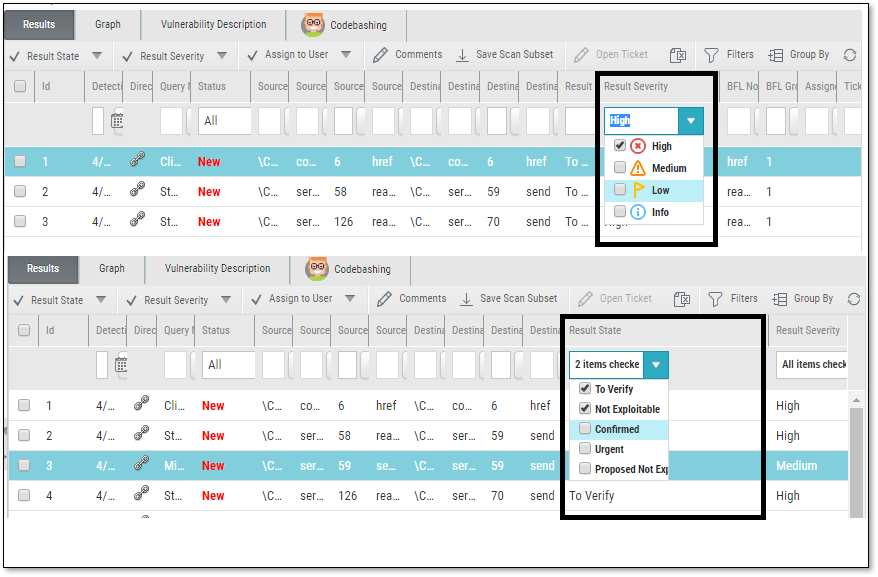
Adding Custom Result States
Result States are useful for marking scan results. For example, marking results as false positives indicates to your team that they can be disregarded. Similarly, marking a result as urgent indicates to your team that it must be handled as soon as possible. In the screen below, the Result State column shows that all the results are marked with the “To Verify” default state.
Notice
Changes to the Result State are saved as part of the project's metadata. Therefore, even if all scans are deleted from a project, the changes remain in effect and will be applied to future scans.
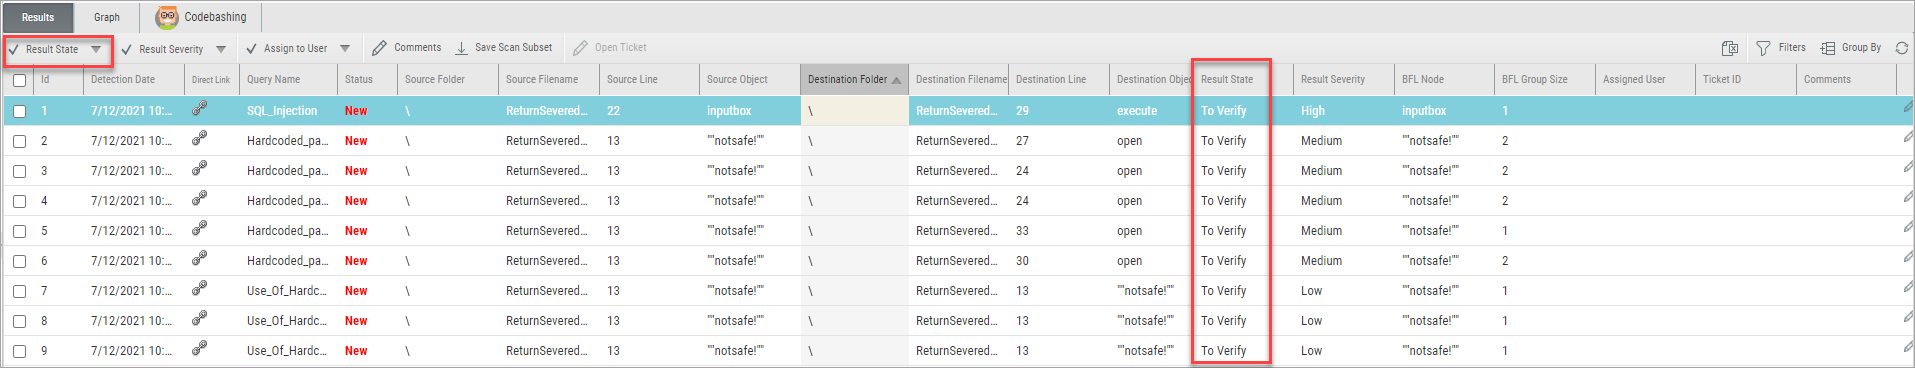 |
To mark a Result State, use the Result State drop-down menu, accessed from the upper-left corner, as shown in the above screen.
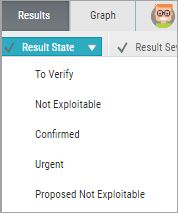 |
The following pre-defined result states are provided:
To Verify (default) – instance requires verification of an authorized user.
Not Exploitable – instance has been confirmed as not exploitable (i.e. false positive). Instances defined with this state are not represented in the scan summary, graph, reports, or dashboard.
Confirmed – instance has been confirmed as exploitable and requires handling.
Urgent – instance has been confirmed as exploitable and requires urgent handling.
Proposed Not Exploitable – instance has been proposed as not exploitable (since it may be a false positive). Instances defined with this state are represented in the scan summary, graph, reports, or dashboard until the state is changed to “Not Exploitable".
For more information, see the Results section above.
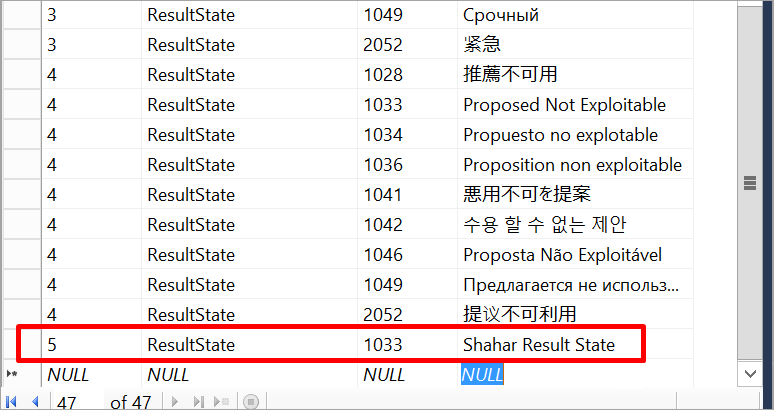
If a user requires additional states or prefers states with different terminology, user-defined custom result states can be added. The custom states will be added to the Result State drop-down menu.
To add user-defined custom result states:
Open the CxSAST database.
Open the Translations table.
Add a new record to the Translations table with the new result state.
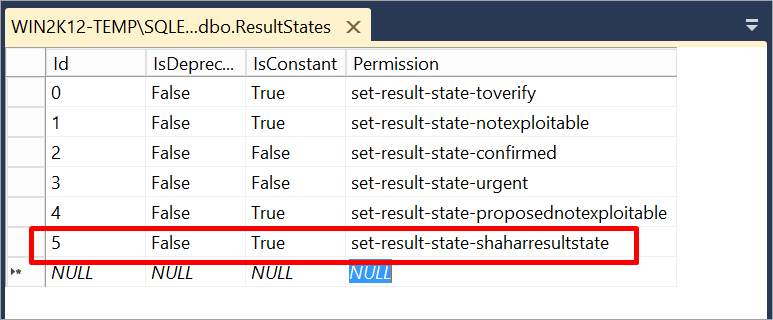
Open the Result States table.
Add a new record to the Result States table.
Restart the CxSystemManager service.
If you are creating more than one custom result state, also run IISRESET.
Login to Checkmarx SAST Web portal.
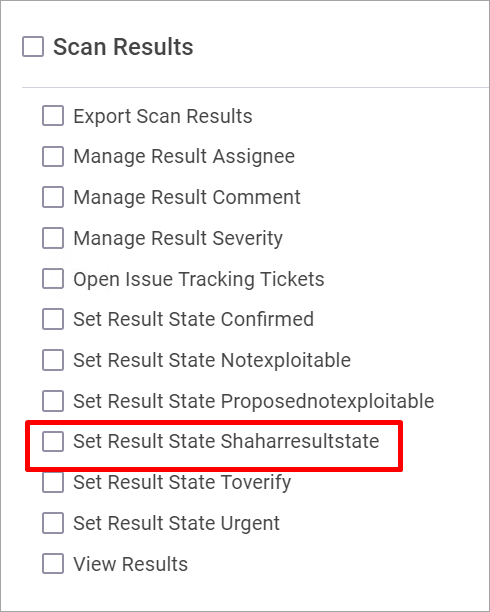
Go to Access Control--> Roles.
Click Add new role. The new custom result state is displayed in the list of roles, under Scan Results.