- Checkmarx Documentation
- Checkmarx One
- Checkmarx One Integrations
- CI/CD Integrations
- Checkmarx One Azure DevOps Plugin
- Viewing Checkmarx One Results in Azure
Viewing Checkmarx One Results in Azure
The Checkmarx One Azure plugin generates a results summary and a log of the scan execution. Both are available on the Build page for each build (scan) of a project. In addition Azure provides a link to view comprehensive scan results in Checkmarx One.
Note
If the no wait option --nowait, -w was added to the additional arguments, no results will be provided in Azure.
Viewing the Scan Results Summary
You can view the results summary directly in the Azure console or by downloading an HTML file. The items in the summary are described in the table below.
To view the scan results summary via the Azure console:
On the main Pipelines screen, click on a Pipeline and select a specific run.
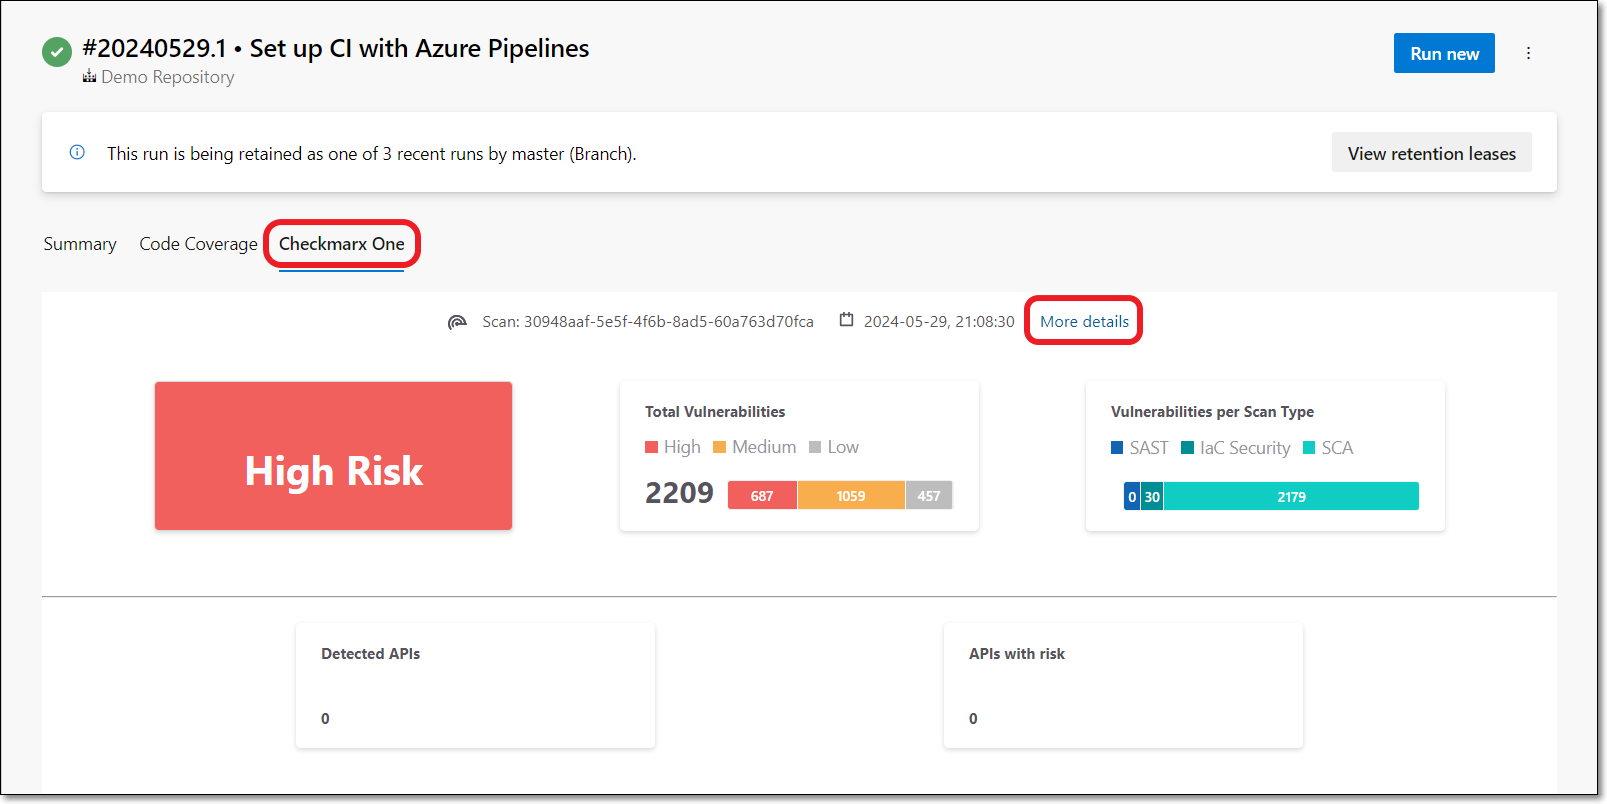
On the Run page, select the Checkmarx One tab.
The scan summary is shown. The scan summary is described in the table below.

You can view comprehensive results in Checkmarx One by clicking on the More details link at the top of the screen. For an explanation of the scan results, see Viewing the Project Page in the Checkmarx One User Guide.Viewing Scan Results
Understanding the Scan Results Summary
Item | Description | Possible Values | |
|---|---|---|---|
Risk Level | The highest risk level of any vulnerability identified in the Project. | Critical, High, Medium, or Low | |
Total Vulnerabilities | The combined total number of vulnerabilities in your Project followed by a color coded bar graph indicating the number of vulnerabilities of each severity level (Critical, High, Medium, and Low). | e.g.,
| |
Vulnerabilities per Scan Type | A color coded bar graph indicating the number of vulnerabilities identified by each of the scanners (SAST, IaC Security, SCA, API Security, Container Security and Software Supply Chain Security. | e.g.,
|
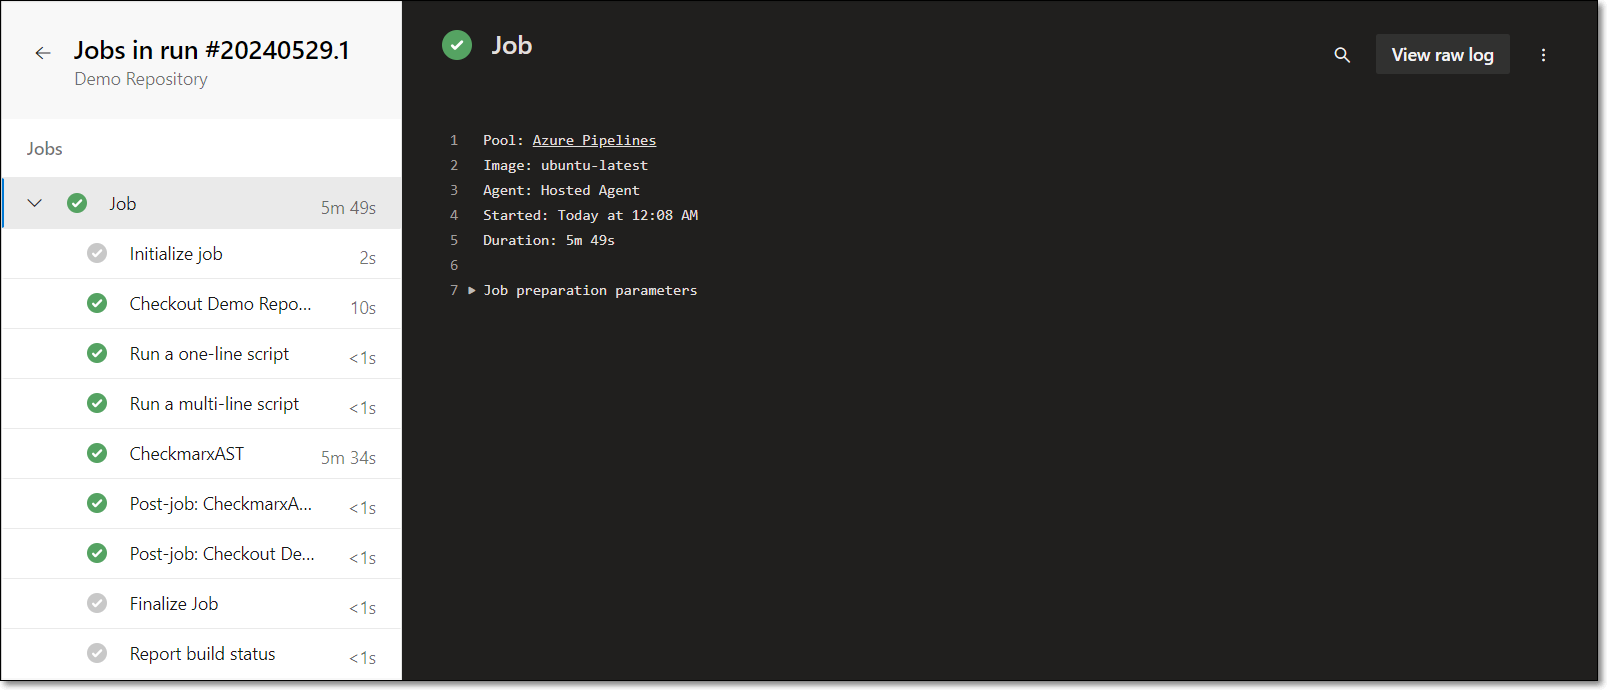
Viewing a log of the scan execution
To view a log of the scan executions:
On the Run page, select the Summary tab.
Click on the job that contains the Checkmarx One scan.
Click on an execution step to view logs in the right side pane.


