Usage Dashboard
Dev Assist Dashboard
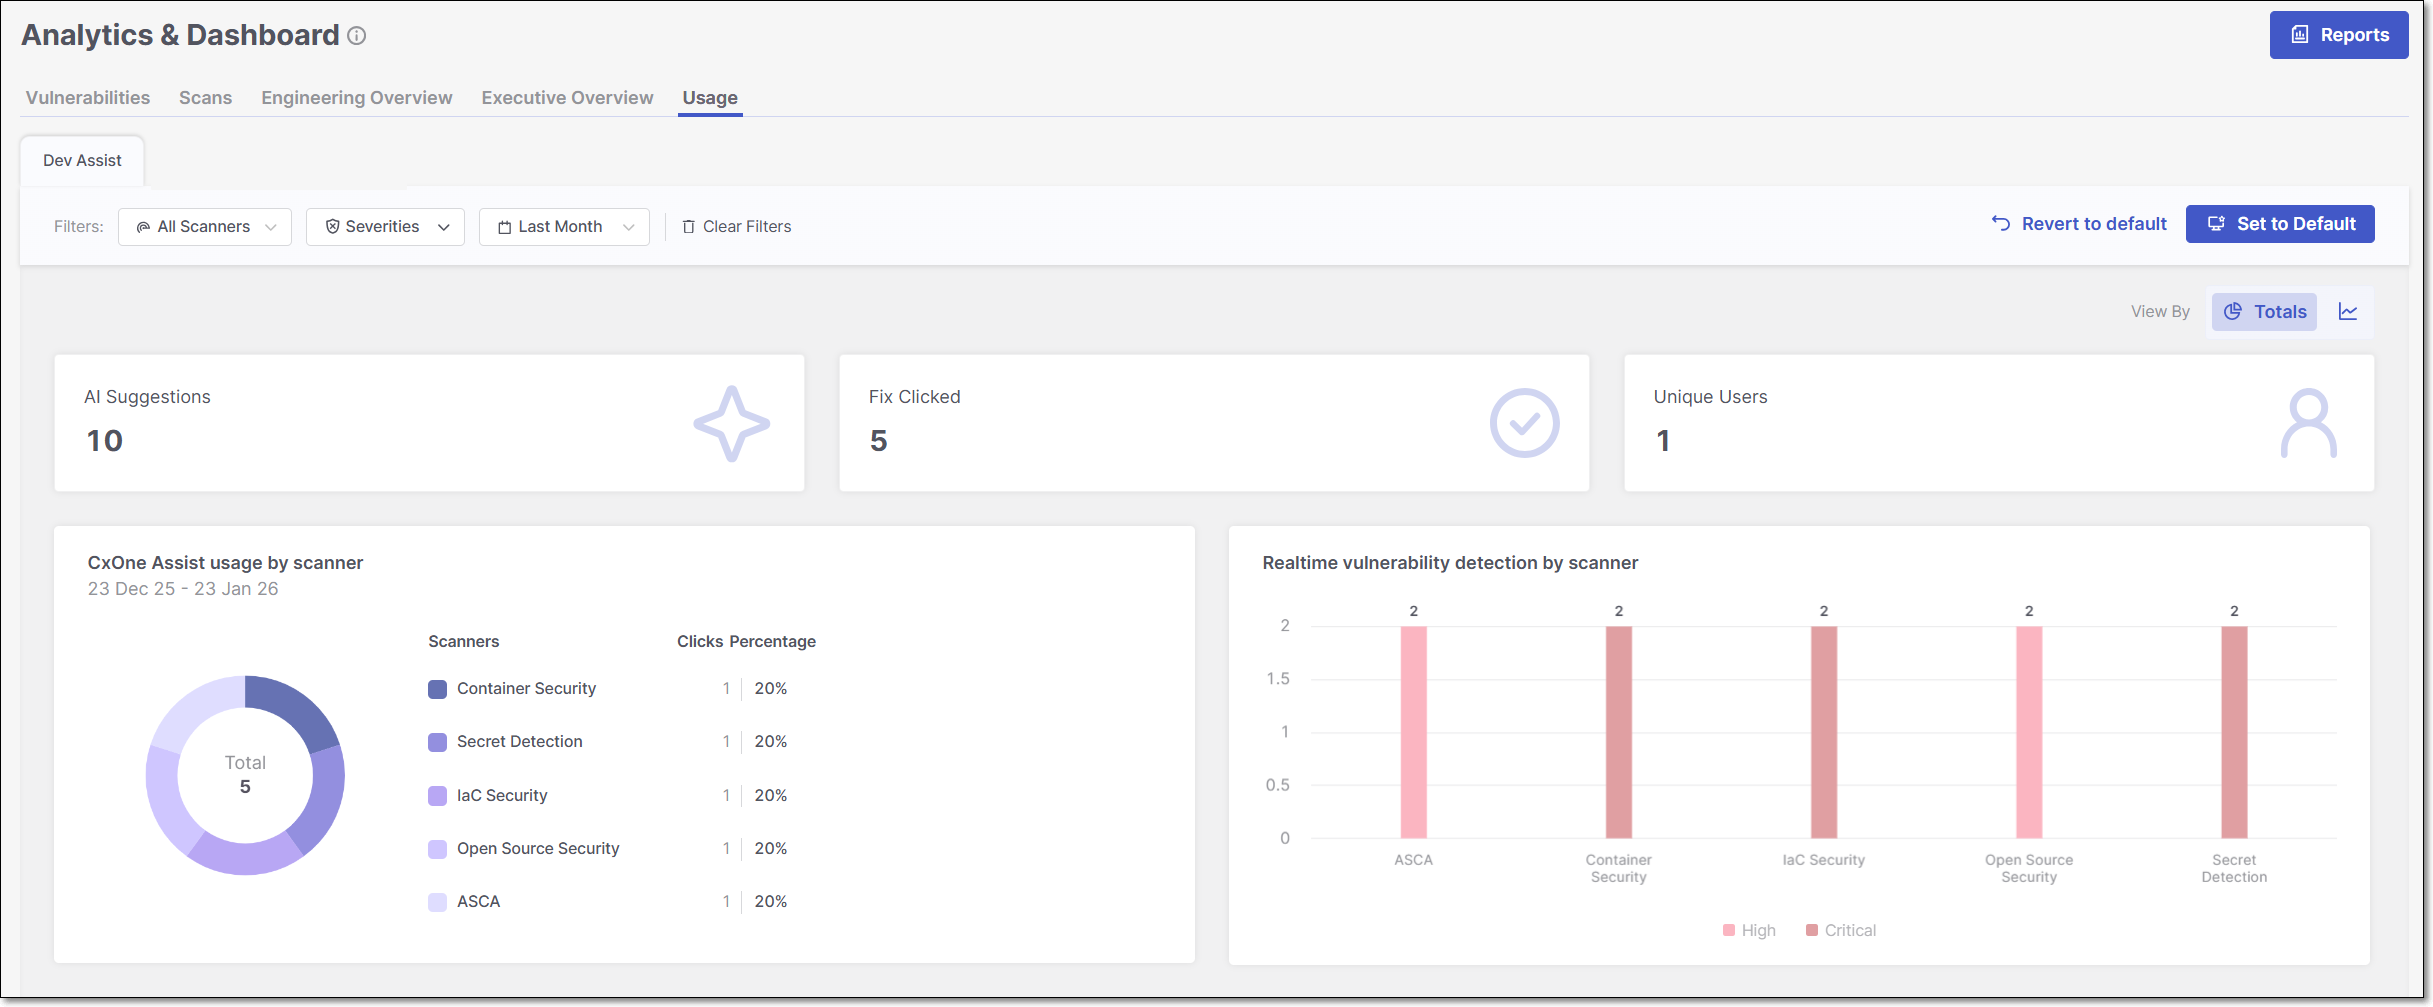
The Usage > Dev Assist dashboard provides visibility into how developers use Checkmarx Developer Assist IDE plugins during development. The metrics show the volume of AI-generated remediation suggestions, how often fixes are generated, and real-time vulnerability detection activity. It helps teams understand adoption, usage patterns, and the impact of Checkmarx Assist and Realtime Scanners over time.
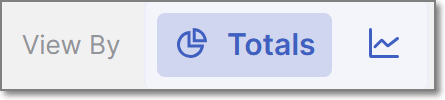
The Usage > Dev Assist dashboard can be viewed in two different modes: Over Time view type and Totals view type. To toggle between the two views, click on the View By icons at the top right of the page.
 |
Tip
For a broader explanation of the advantages and purpose of each view type, refer to the documentation on Data presentation modes.
Filtering
The Usage > Dev Assist dashboard offers advanced data filtering options, allowing users to customize their analysis to specific criteria. The available filters can be accessed directly at the top of the table.
For a detailed description of each filter, see Filtering
Below is a list of available filters for this dashboard:
Scanners
Severity - Default: Critical, High and Medium.
Time Range - Default: Last Month.
Dashboard Widgets
At the top of the Usage > Dev Assist dashboard, three summary widgets are consistently displayed across all view types - AI Suggestions, Fix Clicked, and Unique Users, . The remaining widgets, CxOne Assist Usage by scanner and Realtime vulnerability detection by scanner, vary depending on whether the dashboard is set to the Over Time view or the Totals view, allowing you to explore different perspectives of the scan data.
Below is a breakdown of the different widgets with their descriptions.
Dashboard Widgets
AI Suggestions: shows the total number of AI-generated remediation recommendations surfaced to developers.
Fix Clicked: shows how many times developers actively clicked on the Fix with Checkmarx One Assist button to get an AI generated fix.
Unique Users: shows the number of distinct users who used the Developer Assist IDE plugins.
CxOne Assist Usage
In Totals view: shows how often developers clicked AI-generated fixes, broken down by scanner type and displayed as a donut chart with percentages representing each scanner’s share of total usage.
In Over Time view: shows how often developers clicked AI-generated fixes over the selected period, broken down by scanner type and displayed as a time-based trend to illustrate usage patterns over time.
Notice
Supported scanners: IaC Security, Container Security, ASCA and Open Source Security.
Realtime Vulnerability Detection
In Totals view: shows the total number of vulnerabilities detected by Checkmarx Realtime Scanners while developers code in the IDE, aggregated by severity for the selected period.
In Over Time view: shows when vulnerabilities were detected by Checkmarx Realtime Scanners over the selected period, with separate trend lines for each severity level.
Notice
Supported scanners: IaC Security, Container Security, ASCA and Open Source Security.