- Checkmarx Documentation
- IAST Documentation
- User Guide
- Working with the IAST Web Interface
- Working with Scans
Working with Scans
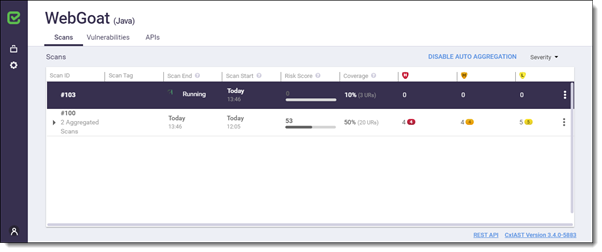
In the Project View, click the Scans tab to display the Scan List with information about all the scans for the selected project. The Scan List can be viewed using Auto Aggregation. Enabling Auto Aggregation combines all the scans from the same application (executable) version into a single aggregated scan line in the Scan List. The aggregated scan line can be expanded by clicking the triangle on the left side of the listed scan. Application version changes are automatically detected by IAST.

Note
Auto aggregation is achieved by identifying that the agent scan relates to the same version of the application. Any change in the Java binaries results in a new aggregated scan. Changing UI (JS files) may not create a new aggregated scan. This can be useful in cases where the same version of the application is tested in multiple environments.
Item | Description |
|---|---|
Scans | This list represents the last scans for the project. A running scan is calculated from the time when the application under test started. A completed scan is calculated from the time when the application under test is started to the time when the application stops. This is automatically refreshed once a running scan is complete or a new scan is activated. This list includes information from all previous scans. |
Scan ID | The unique ID of the scan, for example #103 for the selected scan in the screen image. |
Scan Tag | Free text, for example to relate between the scan and the type of functional test performed. This can be added while setting up and configuring the agent see Configuring the AUT Environment, using the API or via Jenkins plugin. |
Scan End | The date and time when the scan was completed. |
Scan Start | The date and time when the scan was started. |
Risk Score | The calculated risk level ranging from 0 (low risk) to 100 (highest risk). This value is a function of the number and the severity of detected vulnerabilities. |
Coverage | The estimation in per cent of used methods and the number of distinct Unique Requests (URs) logged. This value provides the means to measure the quality/coverage of the scan. NoteThis parameter is available for Java applications only. |
High | Vulnerabilities of high severity. |
Medium | Vulnerabilities of medium severity. |
Low | Vulnerabilities of low severity. |
Number provided in the severity group | Displays the number of vulnerabilities for each severity group. This label indicates for example 8 high severity vulnerabilities. |
Obtain additional information on a vulnerability detected in this project by pointing to it. The first value states the total number of vulnerabilities detected while the second value states the number of new vulnerabilities.  | |
ENABLE/DISABLE AUTO AGGREGATION | Enabling Auto Aggregation combines all scans from the same application version into the same aggregated scan line in the Scan List. Disabling this option expands all the scans in the Scan List. |
Severity | Click the small triangle to display a drop-down list from where you can select or clear severity to show or hide respectively. |
More Options | Click More Options to show additional options:
|
Exporting the Scan Results to CSV
Once a scan is complete and the results are displayed you can export the results to a CSV format file for analysis purposes.
To export the scan results to CSV, go to the Scans List (Projects > Projects View > Scans List tab), click More Options located next to the scan that you want to export and select Export to CSV. The IAST <scan results>.zip archive is downloaded to your default download directory.
When API coverage is supported, it will also be part of the zip file.
Exporting the Scan Results to PDF
Once a scan is complete and the results are displayed you can export the results to a PDF format file for analysis purposes.
To export the scan results to PDF, go to the Scans List (Projects > Projects View > Scans List tab), click located next to the scan that you want to export and select Export to PDF. The IAST <scan results>.zip archive is downloaded to your default download directory.
API Discovery and Coverage
With IAST API Discovery and Coverage you can identify which APIs are exposed, the age of an API, and which APIs have been exercised and which have not.
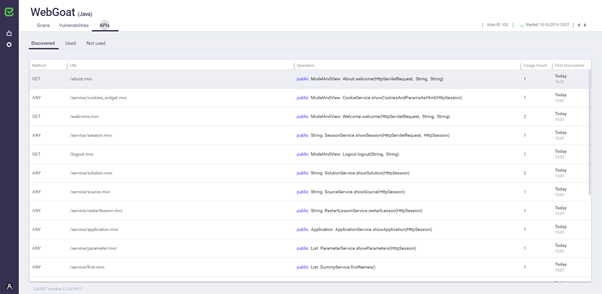
API is a combination of three distinct data points: the HTTP method associated with the request (e.g., Get or Post), the URL of the request, and the associated API operation.
In the Projects View, click the APIs tab to display the API discovered on the selected scan.
API Discovery is currently supported for java on the following frameworks:
Spring MVC
Jersey
The API discovery table presents all the APIs discovered by the IAST agent. The table can be filtered by APIs that were used or not used during the scan. The API coverage presented per scan is calculated based on the used vs. the discovered APIs.

Item | Description |
|---|---|
Method | The HTTP method (GET/POST/...) used for the API. It can be multiple http methods. |
URL | The API URL, as used by clients to invoke the API. |
Operation | The operation/function being called when the API is invoked. |
Usage Count | The number of API calls observed by CxIAST Agent during the scan. Zero or low usage count may help to discover testing coverage issues. |
First Discovered | The date and time when the API was first discovered by CxIAST Agent. Critical information, such as new APIs, may expose new vulnerabilities. |