Application Risk Management
Checkmarx One offers a comprehensive Application Risk Management feature that allows you to prioritize and understand the risks associated with your applications.
This centralized tool consolidates results from multiple scanners, including SAST, SCA, and correlated results risk scores, offering valuable insights for resource or team managers, especially AppSec teams. With this feature, you can proactively pinpoint vulnerabilities that require attention and address them before the development process begins.
This topic will guide you through the Application Risk Management feature and its key components.
Understanding the Application Risk Management Interface
The Application Risk Management page will now serve as the new landing page upon login for users with any of the following roles or a combination of these roles: ast-viewer, ast-scanner, admin. Users who do not have any of these roles will continue to see the Projects & Applications page as their default landing page.
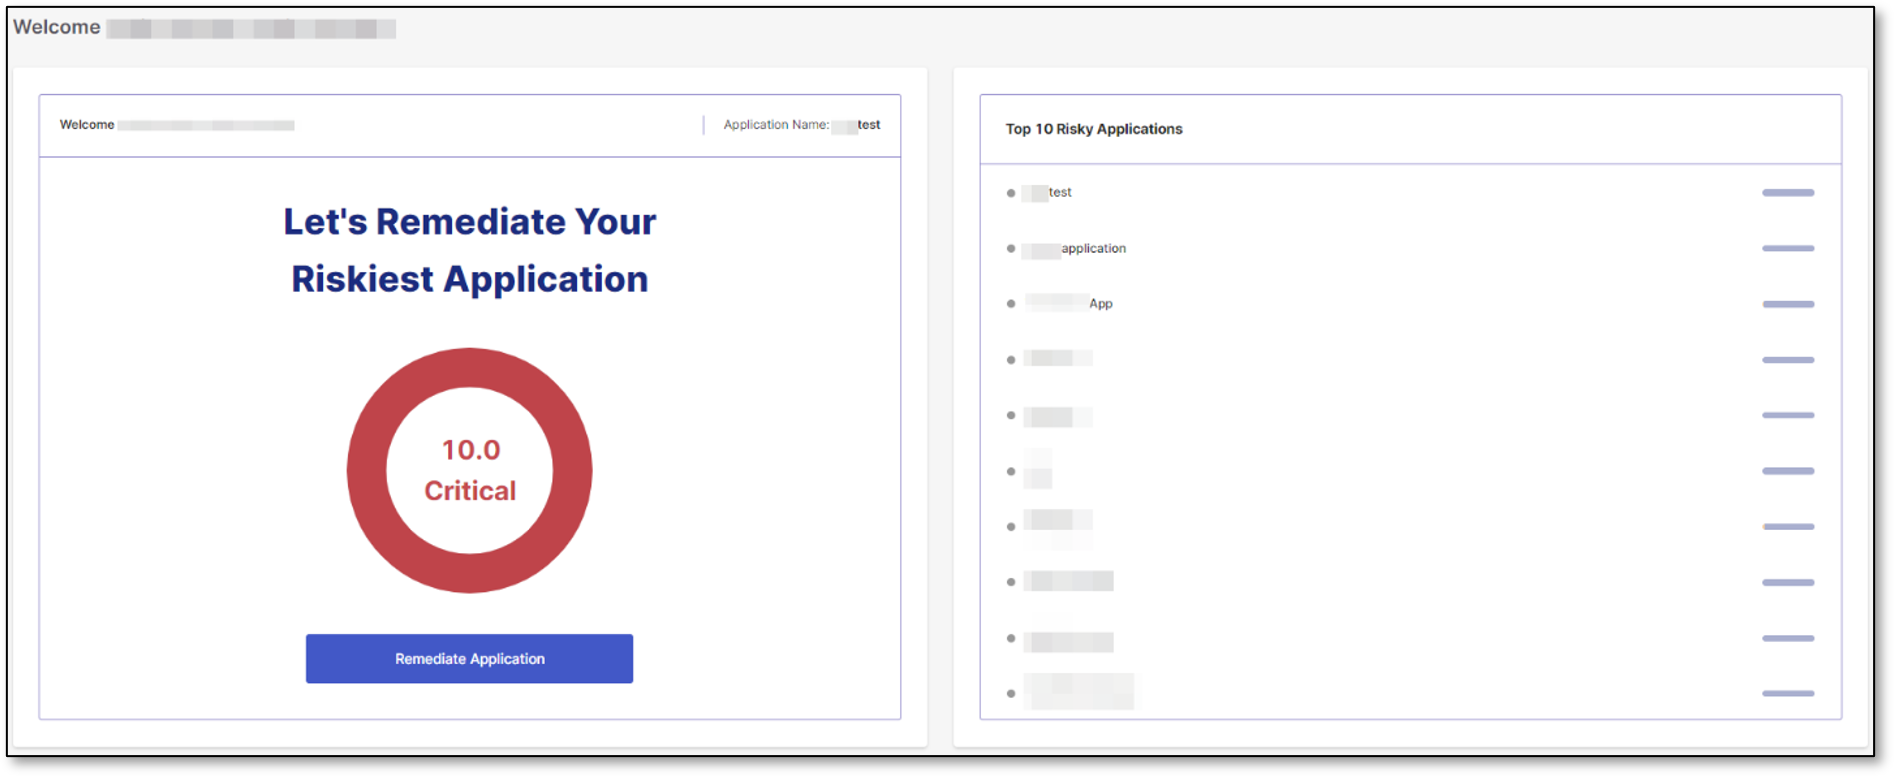
To initiate the Application Risk Management process, click on  > Application Risk Management in the navigation panel on the left. The following screen is displayed:
 |
The left side of the screen shows a prompt that states: Let's Remediate Your Riskiest Application. To help you quickly identify which application needs immediate attention, the name of the riskiest application is shown within a donut chart. This chart visually represents risk on a scale from 1 to 10, where 10 signifies the highest level. For the score calculation details, see Navigating to the Application Risk Management tab.
The left pane also includes the Remediate Application button. Clicking it will redirect you to the Application Risk Management tab, where you can delve into the detailed analysis and management of the identified risks.
The right side of the screen displays up to 10 of the riskiest applications that you manage. By hovering your cursor over a specific application in the list, a View button appears.
Clicking View Results redirects you to the Application Risk Management section, which opens in a new tab within the Applications menu (see the screenshot in Navigating to the Application Risk Management tab).
Hovering over the right end of each row in the top 10 riskiest applications list, shows a popup that provides essential information about the vulnerabilities within that specific application. This popup displays the percentages of new, processed, and analyzed issues present in the application:
 |
Analyzed status indicates vulnerabilities that have been investigated and verified as true positives by the AppSec team.
Processing status represents vulnerabilities that are actively being worked on by the development team.
The term New State pertains to vulnerabilities that have not undergone analysis by any team member. Regardless of whether they are detected during the first, second, or subsequent scans, no one has taken the initiative to commence an investigation on them.
Navigating to the Application Risk Management tab in an Application
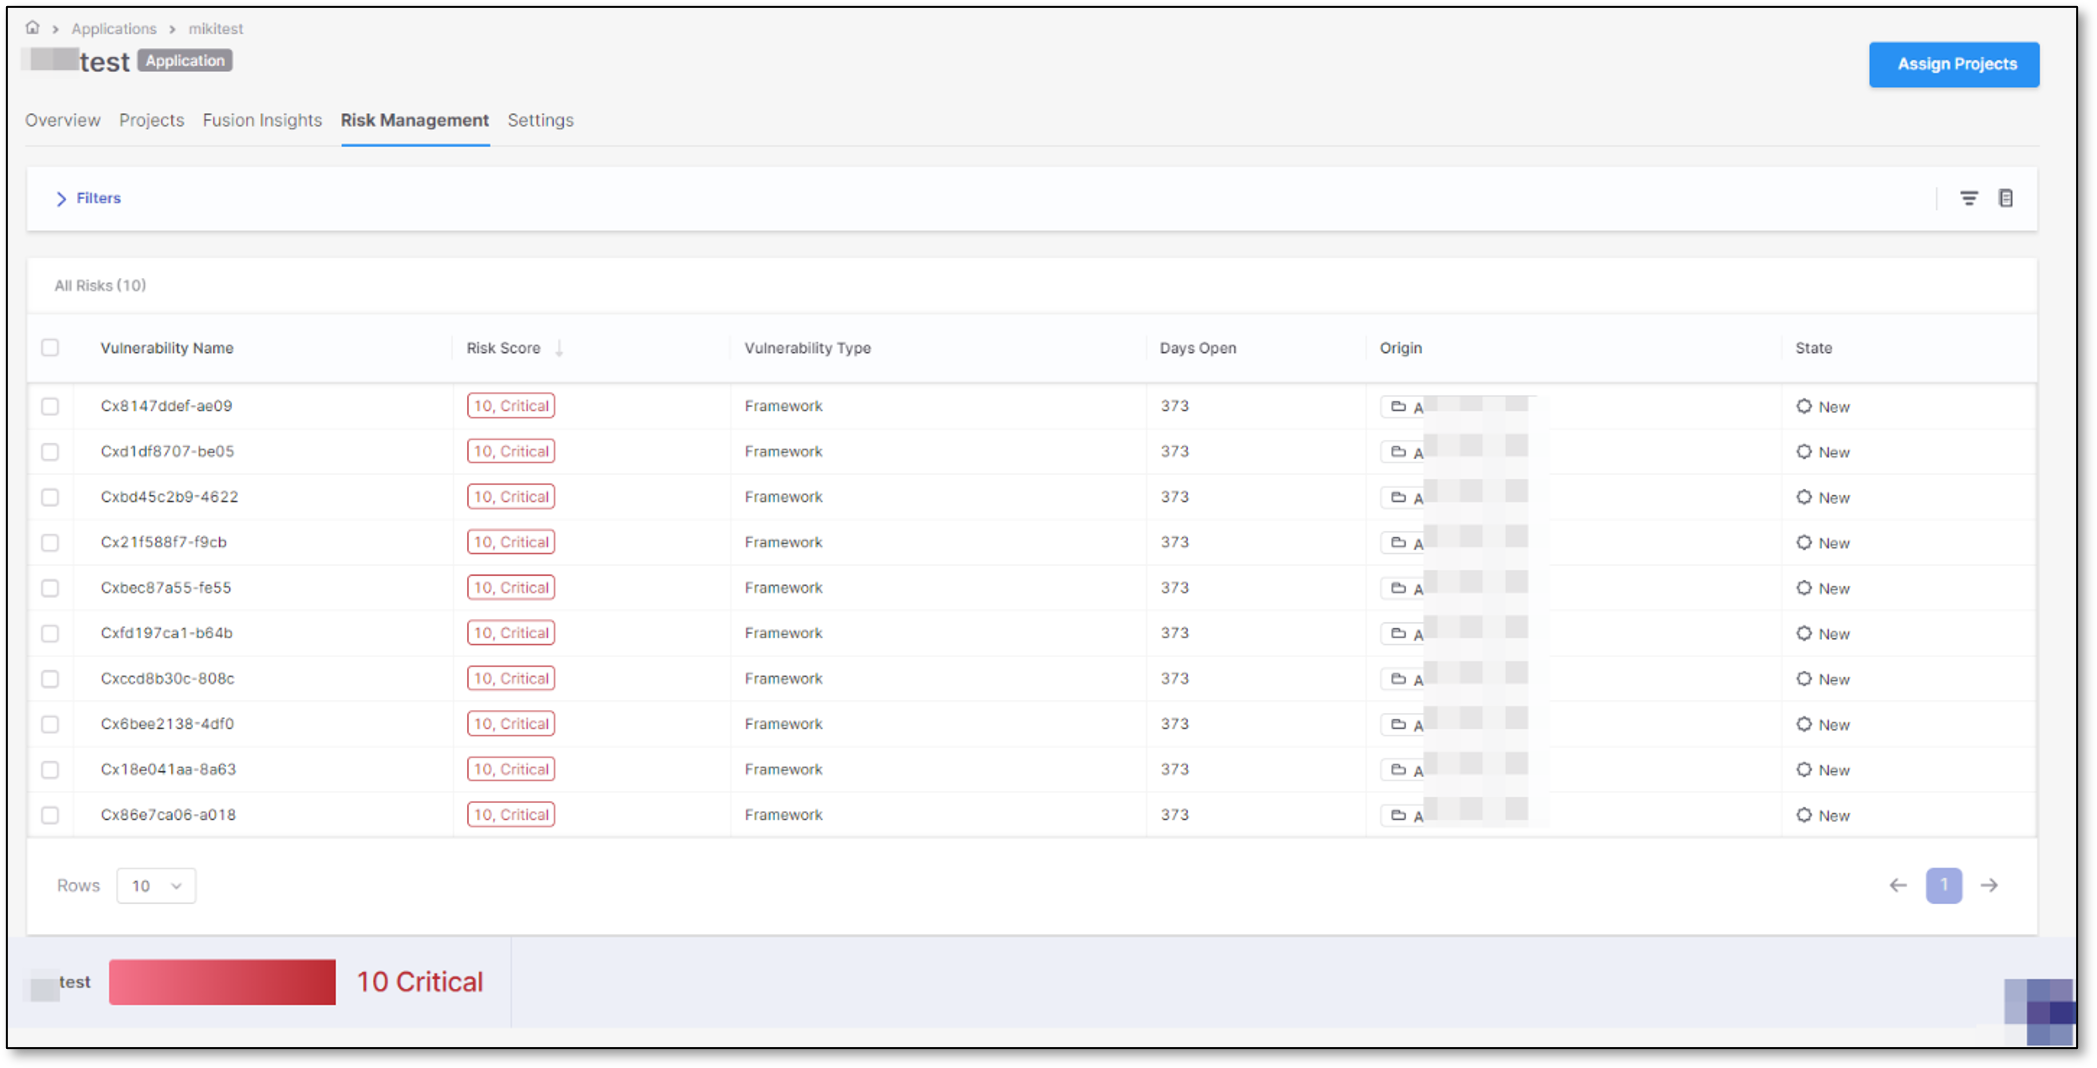
To further explore and manage application risks, click Remediate Application or View Results. This will redirect you to the Application Risk Management tab on the Application page. Here, you will find a table consisting of several columns that provide vital information for risk prioritization and management:
 |
Vulnerability Name: The name of the vulnerability. For SCA, it initially shows risk IDs. For SAST, meaningful names are shown.
Risk Score: The risk of each vulnerability. By default, the scores are arranged in descending order, allowing you to quickly identify the most critical risks.
Vulnerability Type: This column categorizes vulnerabilities based on their general types. This column categorizes vulnerabilities based on their broad categories. In Application Risk Management, the persona profile treats results from different scanners equally and focuses on understanding the context and background of each result. Currently, SCA results are categorized as "Framework," while SAST results are labeled as "Infrastructure." Please note that this column will be customizable in the future.
Days Open: The number of days since the vulnerability was initially detected. It helps you understand the duration of the open risk and prioritize timely actions accordingly.
Origin: This column shows where the vulnerability result originated from, providing insight into its source.
Interacting with the Risk Management table
When you hover your cursor over a specific row, a View button will appear.
For SCA, clicking this button redirects you to the corresponding page in the respective scanner's Scan Results.
For SAST, clicking View opens a new tab next to All Risks, enabling you to view the specific vulnerability in detail and switch back to the main Risk Management view.
For correlated results, clicking this button allows you to view the SAST result (if it is SAST + IaC), and for exploitable paths, you will be redirected to the SCA page.
Note
The purpose of this functionality is to provide a unified view by only opening tabs for SCA results, without redirecting the user to separate pages.
Overall Risk Score
At the top of the Application Risk Management page, right next to the application name, you will find the Overall Risk Score label. This score represents the average risk level for the selected application, providing an overview of its security posture. This risk level score is calculated as follows:
Half of the score is based on the application's criticality level, as specified by the user during application creation or editing. This scale, ranging from 0 to 5, is converted to a scale of 0 to 10 by multiplying by 2.
The other half is derived from the average of 50 individual risk scores.
Risk score scale and calculation
The risk score metric is represented as a decimal number, ranging from 1.0 (indicating no risk) to 10 (indicating critical risk).
Below is the informative scale for the 5 severity level intervals:
Risk Score | Severity Label |
|---|---|
10.0 | CRITICAL |
7.0 | HIGH |
5.0 | MEDIUM |
3.0 | LOW |
1.0 | NONE |
For SCA, the Risk Score is calculated per result as the average of CVSS 3.0 (Common Vulnerability Scoring System) scores. Our AppSec team uses their expertise to assess the risk score for each SAST result. This assessment involves a list of 26 CWEs (Common Weakness Enumerations) that we regularly update and enrich, taking into account the severity of each query for all other CWEs.
For correlated results, we add 1 to the Risk Score, and then normalize the entire set of 50 results, given that our scale ranges from 1.0 to 10.
Accessing Documentation
To gain a more in-depth understanding of each column within the Application Risk Management table and other elements on the screen, you can click on the Documentation icon located in the top-right corner. This opens the Checkmarx Documentation Portal that provides comprehensive explanations and guidance.
Permissions
The tables below outline the permissions corresponding to actions in the Application Risk Management system.
View homepage | View results table | View result detail | |
|---|---|---|---|
view-applications | X | X | X |
view-risk-management | X | X | X |
view-projects | X | X | X |
view-scans | X | X | X |
view-results | X | X | X |
Note
The API for viewing the homepage action requires only the first two permissions: view-applications and view-risk-management.
Update result severity | Update result state | Update result state to not exploitable | Update result state to proposed not exploitable | |
|---|---|---|---|---|
view-applications | X | X | X | X |
view-risk-management | X | X | X | X |
view-projects | X | X | X | X |
view-scans | X | X | X | X |
view-results | X | X | X | X |
update-results | X | X | X | X |
update-result-severity | X | |||
update-result-states | X | X | X | |
update-result-state-not-exploitable | X | |||
update-result-state-propose-not-exploitable | X |
Actions
View homepage: Access the Application Risk Management homepage, applicable to both the user interface (UI) and the API endpoint GET /summary.
View results table: Access the Application Risk Management results displayed in a table format, accessible from the homepage via links for remediation and viewing results. This action encompasses opening the results tab within the application and using the API endpoint GET /:applicationId/results.
View result detail: View detailed information about a specific result within the results table by clicking on the corresponding row.
Update result: Various actions related to updating results, each self-explanatory:
Update result severity
Update result state
Update result state to "not exploitable"
Update result state to "proposed not exploitable"
These actions are performed within the result view, accessible by clicking on any result in the table.
APIs
The following endpoints are available as part of the Application Risk Management functionality:
GET /summary
This endpoint retrieves a summary of the top-risk applications.
GET /:applicationId/results
Use this endpoint to retrieve all results associated with a specific application.
PUT /:applicationId/results/:id
This endpoint enables the update of a specific result within an application.
Limitations
The following limitations are currently applied to the Application Risk Management functionality:
SCA Legal risks are not factored into Application Risk Management results.
If a user changes the severity of a result, regardless of whether it's SAST or SCA, they must initiate a new scan.
Changing the status to Not Exploitable will not eliminate the associated risk. In H1, this will be updated to reflect a risk score of 0.
Filtering and sorting capabilities in the table will be available during H1.